DLCV 02 · Deep Image Classification
Needs: DLCV 01 · Deep Learning for Image Processing and Computer Vision, IP 13 · Image Pattern Classification
Navigate: this page and this track: Navigate: this page and this track
On this page
- What you’ll learn1 min
- The big picture1 min
- The classification problem10 min
- Datasets and why they matter4 min
- CNN architectures and the reasons behind them6 min
- Attention and transformers4 min
- Training recipes4 min
- Transfer learning and fine-tuning1 min
- Self-supervised and foundation-model classifiers2 min
- Robustness and evaluation pitfalls3 min
- Efficiency1 min
- Interpretability: CAM and Grad-CAM1 min
- Modern view2 min
- Key takeaways1 min
- Exercises4 min
- Supplementary notes
- Paper guides
- References
- A worked macro-versus-micro example
- Cohen’s kappa: agreement beyond chance
- Multi-label metrics in detail
- Evaluation benchmarks in detail
- How reliable are ImageNet numbers?
- Why residual networks train: the unrolled gradient
- Two more CNN designs: DenseNet and RegNet
- Squeeze-and-excitation: attention inside a CNN
- Contrastive learning in detail: SimCLR and MoCo
Deep Learning for Computer Vision
Explore this chapter 2 interactive experiments
Move the decision threshold on fixed classifier scores. The confusion matrix changes, and the operating point slides along the ROC and precision-recall curves built from the same scores.
What you’ll learn
- Match single-label and multi-label tasks to outputs, losses and metrics.
- Compare CNN and Transformer backbones by design and cost.
- Separate architecture gains from training-recipe gains.
- Choose linear probing, fine-tuning or zero-shot transfer.
- Evaluate class imbalance, calibration, distribution shift and deployment efficiency.
The big picture
Image classification asks one question of a whole image: which of these labels fits? It is the oldest deep-learning benchmark task and still the place where most backbone networks are born. A detector, a segmenter or a restoration network usually starts from a backbone that was first trained, or at least evaluated, as an image classifier.
This tutorial assumes you know what a convolution, a CNN layer and backpropagation are. The classical side of classification (Bayes classifiers, perceptrons, a small CNN written in NumPy, softmax and cross-entropy derived by hand) is in IP 13. The broad history of deep learning for images is in DLCV 01. Here we go deep on classification itself. For a refresher on activation functions and optimizers, see ML 02 · Neural Networks. A good single survey of the CNN side of this story is Li et al. [1].
Related chapters. DLCV 02A turns classification into comparison: face recognition, embeddings and margin-based losses for open-set problems. DLCV 01B compares how classification and restoration networks compose the same building blocks.
The classification problem
Plain version. A classifier produces class scores. The loss compares their probabilities with labels and updates the network to improve its predictions.
Single-label, multi-label and fine-grained
Let be an RGB image and a set of classes. A network with parameters maps the image to a vector of logits , one unnormalized score per class.
- Single-label (multi-class) classification assumes exactly one correct class . The logits are turned into a probability vector with the softmax,
where is the model’s estimate of . Training minimizes the cross-entropy, the negative log-probability of the true class, averaged over a mini-batch:
where is the batch size and the label of image . The gradient with respect to the logits is (per image), with the one-hot vector of the true class; DIP Chapter 13 derives it.
-
Multi-label classification allows any subset of labels (a street photo can contain “car”, “person” and “bicycle”). Each class gets an independent sigmoid and a binary cross-entropy, , where says whether class is present. Metrics change too: mean average precision over classes replaces accuracy.
-
Fine-grained classification separates visually similar subordinate classes, such as 200 bird species or 1,000 aircraft variants. The loss is the same as single-label, but the signal lives in small parts (a beak shape, a wing bar), classes are often long-tailed, and label noise from non-expert annotators is common. iNaturalist [6] is the standard large fine-grained benchmark.
Metrics: top-1, top-5 and beyond
Top-1 accuracy is the fraction of images whose highest-scoring class is the true one. Top- accuracy counts an image as correct if the true class is among the highest scores. The ImageNet challenge reported top-5 error because many images contain several objects, and some classes are nearly indistinguishable [2]. Top-5 hides real mistakes, so modern papers mostly report top-1. For imbalanced data, report balanced accuracy (the mean of per-class recalls) or per-class results, because a classifier can score high accuracy by ignoring rare classes.
Code · Python · 18 lines
import torch
import torch.nn.functional as F

logits = torch.tensor([[2.0, 1.0, 0.1, -1.0],    # 2 images, 4 classes
                       [0.5, 2.5, 2.4, 0.0]])
y = torch.tensor([0, 2])

p = logits.softmax(dim=1)
ce = F.cross_entropy(logits, y)                       # mean of -log p[i, y_i]
ce_ls = F.cross_entropy(logits, y, label_smoothing=0.1)
top1 = (logits.argmax(1) == y).float().mean()
top2 = (logits.topk(2, dim=1).indices == y[:, None]).any(1).float().mean()
print(p.round(decimals=3))
print(f"CE {ce:.3f}  CE+LS {ce_ls:.3f}  top-1 {top1:.2f}  top-2 {top2:.2f}")

# multi-label: one independent sigmoid per class, binary cross-entropy
targets = torch.tensor([[1., 0., 1., 0.], [0., 1., 1., 0.]])
print(f"BCE {F.binary_cross_entropy_with_logits(logits, targets):.3f}")
The second image is a near-tie between classes 1 and 2. Top-1 counts it as wrong; top-2 counts it as right. That one example is the whole argument for and against top-5.
The confusion matrix and the metrics built on it
Plain version. Accuracy summarizes correctness; a confusion matrix shows which classes are confused. Choose additional metrics to expose the errors that matter.
The binary case: TP, FP, FN, TN
Take one class as positive (say “sick”) and the rest as negative. Each prediction lands in one of four cells:
| Predicted positive | Predicted negative | |
|---|---|---|
| Actually positive | true positive (TP) | false negative (FN) |
| Actually negative | false positive (FP) | true negative (TN) |
With test examples, the standard ratios are
- Precision answers “when the model says positive, how often is it right?” It matters when a false alarm is costly: a spam filter that hides real mail, an automatic product recall.
- Recall, also called sensitivity or the true positive rate (TPR), answers “of all real positives, how many did we catch?” It matters when a miss is costly: cancer screening, a defect detector on a production line.
- Specificity, the true negative rate (TNR), is recall for the negative class. The false positive rate (FPR) is its complement, the fraction of negatives wrongly flagged.
Precision and recall pull against each other: lowering the decision threshold flags more items, which raises recall and usually lowers precision. Single numbers that combine them are:
where is precision, recall and says how many times more recall matters than precision ( favours recall, favours precision). is the harmonic mean, so it is high only when both parts are high. Note what ignores: true negatives never appear in it.
Two further summaries use all four cells:
Balanced accuracy is the mean of the per-class recalls, so a classifier that ignores one class scores 0.5 however rare that class is. The Matthews correlation coefficient (MCC) is the Pearson correlation between the true and predicted binary labels: is perfect, is no better than chance, is perfectly inverted. Chicco and Jurman [57] argue that it should be preferred over accuracy and for binary evaluation because it is high only when the classifier does well in all four cells. Sokolova and Lapalme [58] give a systematic comparison of these measures and of how each one reacts to changes in the confusion matrix.
Why accuracy misleads at 99:1. Suppose 10 of 1,000 scans are sick. A “model” that always answers healthy scores 99.0% accuracy. Model B flags 30 scans and catches 8 of the 10 sick ones; it scores lower accuracy (97.6%) yet is the only useful one:
Code · Python · 18 lines
import numpy as np
from sklearn.metrics import (accuracy_score, balanced_accuracy_score, confusion_matrix,
                             f1_score, matthews_corrcoef, precision_score, recall_score)

# 1,000 scans, 10 sick (label 1). Model A says "healthy" to everyone.
# Model B flags 30 scans and catches 8 of the 10 sick ones.
y = np.r_[np.ones(10), np.zeros(990)].astype(int)
pred_a = np.zeros(1000, dtype=int)
pred_b = np.r_[np.ones(8), np.zeros(2), np.ones(22), np.zeros(968)].astype(int)

for name, p in [("all-negative", pred_a), ("model B", pred_b)]:
    tn, fp, fn, tp = confusion_matrix(y, p).ravel()
    print(f"{name:12s} TP={tp} FP={fp} FN={fn} TN={tn}  "
          f"acc={accuracy_score(y, p):.3f} bal-acc={balanced_accuracy_score(y, p):.3f} "
          f"P={precision_score(y, p, zero_division=0):.3f} R={recall_score(y, p):.3f} "
          f"F1={f1_score(y, p, zero_division=0):.3f} MCC={matthews_corrcoef(y, p):.3f}")
# all-negative TP=0 FP=0 FN=10 TN=990  acc=0.990 bal-acc=0.500 P=0.000 R=0.000 F1=0.000 MCC=0.000
# model B      TP=8 FP=22 FN=2 TN=968  acc=0.976 bal-acc=0.889 P=0.267 R=0.800 F1=0.400 MCC=0.454
Balanced accuracy, and MCC all rank model B first; accuracy ranks it last. Rules of thumb: use accuracy only when classes are roughly balanced and all errors cost the same; report precision and recall (or with a chosen from the real costs) when one kind of error matters more; use balanced accuracy or MCC as a single imbalance-aware summary.
The multi-class confusion matrix
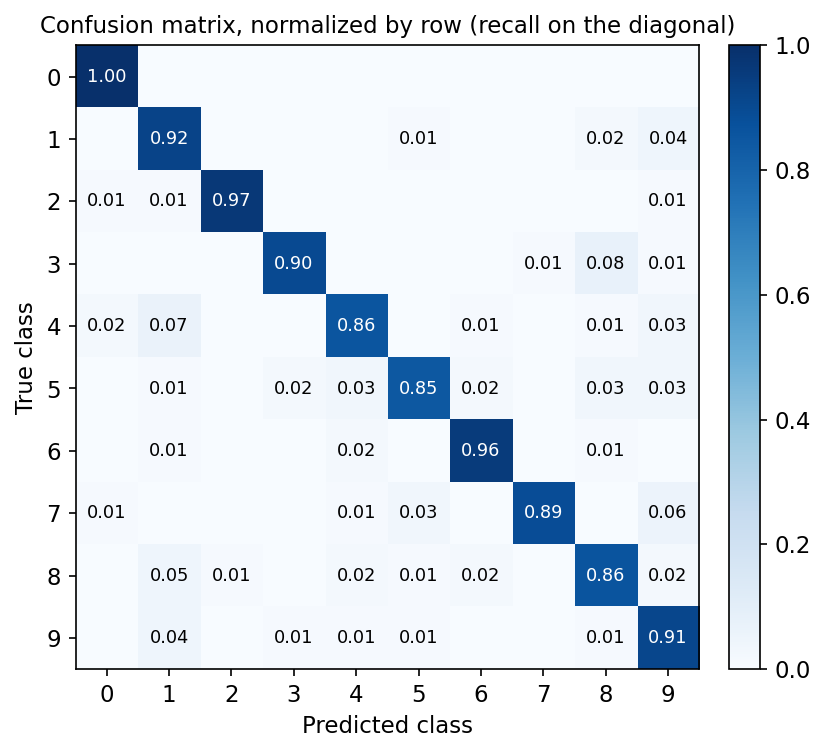
With classes the confusion matrix has entry = number of test images whose true class is (row) and whose predicted class is (column); this is the convention of scikit-learn [62]. The diagonal holds the correct predictions. Dividing each row by its sum gives the row-normalized matrix, whose diagonal is the per-class recall and whose off-diagonal entries show which classes are confused. Figure 1 shows one for a logistic regression trained on only 200 of scikit-learn’s digits: most mistakes are 3 → 8, 4 → 1 and 7 → 9, pairs that share strokes.
Treating each class in turn as “positive” and all others as “negative” gives per-class counts: , (the rest of column ), (the rest of row ). Hence per-class precision and recall . There are three common ways to turn per-class numbers into one:
- Macro average: the plain mean over classes, . Every class counts equally, so rare classes weigh as much as common ones.
- Micro average: sum , , over classes first, then compute the metric once. In single-label multi-class problems every error is one FP (for the predicted class) and one FN (for the true class), so micro precision = micro recall = micro = accuracy.
- Weighted average: the mean of per-class values weighted by each class’s support (number of true examples). It sits close to micro and hides rare-class failures almost as well.
On an imbalanced test set the averages can differ a lot. If a model is good on a common class and poor on rare ones, micro averaging (dominated by the common class) gives a high score and macro averaging a much lower one; that gap is the signal. Report macro when every class matters (rare diseases, rare species); report micro/accuracy when every image matters equally.
Optional: A worked macro-versus-micro example (in the Supplementary notes). A small three-class confusion matrix worked through by hand.
Cohen’s kappa [59] is accuracy corrected for chance: it compares the observed agreement between predictions and labels with the agreement a classifier would reach by guessing each class at its observed rate. It is 1 for perfect agreement and 0 at chance level, and it is common when a model is compared with human annotators.
Optional: Cohen’s kappa: agreement beyond chance (in the Supplementary notes). The formula and its value for the digit classifier below.
Code · Python · 26 lines
from sklearn.datasets import load_digits
from sklearn.linear_model import LogisticRegression
from sklearn.metrics import (average_precision_score, classification_report,
                             confusion_matrix, precision_recall_fscore_support, roc_auc_score)
from sklearn.model_selection import train_test_split
from sklearn.preprocessing import label_binarize

X, y = load_digits(return_X_y=True)
X_tr, X_te, y_tr, y_te = train_test_split(X, y, test_size=0.5, stratify=y, random_state=0)
clf = LogisticRegression(max_iter=2000).fit(X_tr[:200], y_tr[:200])   # only 200 labels
pred, prob = clf.predict(X_te), clf.predict_proba(X_te)

cm = confusion_matrix(y_te, pred)                     # rows = true, columns = predicted
cm_norm = confusion_matrix(y_te, pred, normalize="true")   # each row sums to 1 (Figure 1)
print(classification_report(y_te, pred, digits=3))    # per-class P, R, F1, support + averages
for avg in ["macro", "micro", "weighted"]:
    p, r, f, _ = precision_recall_fscore_support(y_te, pred, average=avg)
    print(f"{avg:8s} P={p:.3f} R={r:.3f} F1={f:.3f}")
print(f"ROC-AUC (one-vs-rest, macro) {roc_auc_score(y_te, prob, multi_class='ovr'):.4f}")
Y = label_binarize(y_te, classes=range(10))           # one binary column per class
print(f"mean AP over classes {average_precision_score(Y, prob, average='macro'):.4f}")
# macro    P=0.914 R=0.911 F1=0.912
# micro    P=0.911 R=0.911 F1=0.911
# weighted P=0.915 R=0.911 F1=0.912
# ROC-AUC (one-vs-rest, macro) 0.9958
# mean AP over classes 0.9742
Here macro and micro agree because the digit classes are balanced; on an imbalanced test set they would not.
Threshold-free evaluation: ROC and precision–recall curves
Every metric above needs a decision rule (argmax, or “positive if the score exceeds ”). A scoring classifier can be evaluated at all thresholds at once. Sweep from high to low and record a point per threshold:
- The ROC curve plots TPR against FPR. Its area, ROC-AUC, equals the probability that a randomly chosen positive gets a higher score than a randomly chosen negative; 0.5 is chance, 1.0 is perfect separation. Fawcett [54] is the standard introduction.
- The precision–recall (PR) curve plots precision against recall. Its summary, average precision (AP), is the precision averaged over the recall levels at which a new positive is retrieved,
where and are precision and recall at the -th threshold, ordered by decreasing score (this is scikit-learn’s definition [62]; benchmarks such as PASCAL VOC [61] have used interpolated variants, so check which one a paper reports).
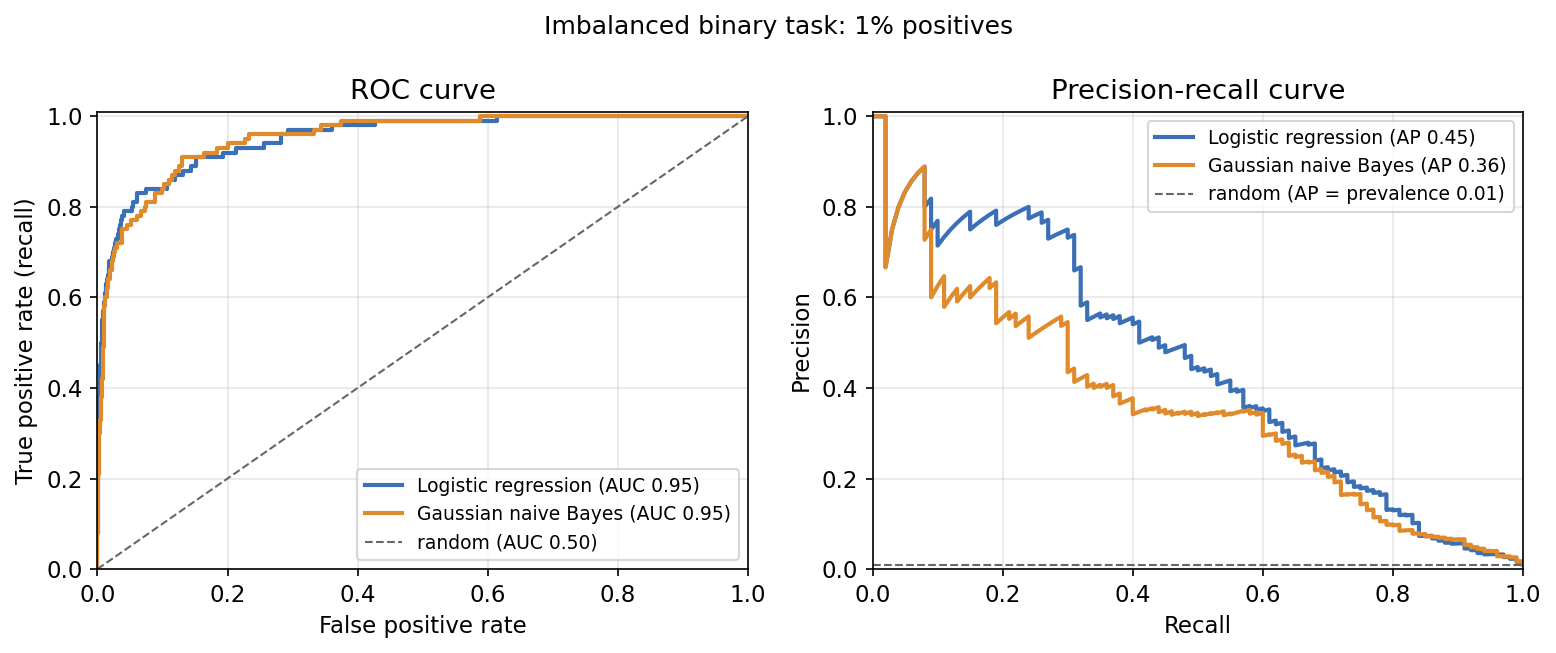
Why PR under heavy imbalance. FPR divides by the number of negatives. When negatives outnumber positives 99 to 1, even thousands of false alarms barely move FPR, so the ROC curve looks excellent while precision is poor. Precision divides by the number of flagged items, so false alarms hit it directly, and the random baseline of AP equals the positive rate rather than 0.5. Davis and Goadrich [55] proved that a curve dominates in ROC space if and only if it dominates in PR space, and showed that optimizing ROC-AUC does not optimize AP; Saito and Rehmsmeier [56] showed with simulations and a literature review that PR plots are more informative than ROC plots on imbalanced data. Figure 2 makes this concrete: two classifiers with the same ROC-AUC (0.95) on a task with 1% positives differ clearly in AP (0.45 against 0.36).
For classes, both curves are computed one-vs-rest: class is positive, all others negative, using the score . The areas are then macro-averaged (roc_auc_score(..., multi_class="ovr")), or micro-averaged by pooling all pairs.
Multi-label metrics
In multi-label classification each label is its own yes/no problem, so the standard summary is the average precision of each class, averaged over classes into mAP, as in the PASCAL VOC classification task [61]. Thresholded metrics either compute a binary metric per label and average it over labels (macro or micro, as above), or score each image’s predicted label set and average over images.
Optional: Multi-label metrics in detail (in the Supplementary notes). Example-based F1, Hamming loss and a small worked example in code.
Calibration: are the probabilities honest?
Accuracy only checks the argmax. Calibration checks whether the confidence means what it says: among all predictions made with confidence 0.8, about 80% should be right. Formally, a classifier is calibrated if for every confidence , where is the predicted class and its probability. The usual summary is the expected calibration error: split predictions into confidence bins and compute
where is the number of test images, the accuracy inside bin and the mean confidence there. Guo et al. [47] found that modern deep networks, trained long with cross-entropy, tend to be overconfident, and that a single scalar fix works remarkably well. We return to it in the robustness section.
Datasets and why they matter
Plain version. Benchmarks support comparison under fixed conditions. Keep training and evaluation data separate, and check whether benchmark gains transfer beyond that test set.
Training datasets
| Dataset | Images | Classes | Resolution | Role |
|---|---|---|---|---|
| MNIST [3] | 60k train / 10k test | 10 digits | 28×28 gray | sanity check, teaching |
| CIFAR-10 / CIFAR-100 [4] | 50k train / 10k test | 10 / 100 (20 superclasses) | 32×32 RGB | small-scale architecture and recipe studies |
| ImageNet-1k (ILSVRC 2012) [2] | about 1.28M train / 50k val | 1,000 | variable, usually trained at 224×224 | the standard backbone benchmark |
| ImageNet-21k [5] | roughly 13–14M (versions differ) | about 21k | variable | larger-scale supervised pre-training |
| iNaturalist [6] | hundreds of thousands, by year | thousands of species | variable | fine-grained, long-tailed |
MNIST is solved and now only catches bugs. CIFAR is small enough to run many controlled experiments, which is why regularization papers love it. ImageNet-1k became the reference after the 2012 challenge [2], [10]: architectures are usually reported as “top-1 on ImageNet-1k val at 224×224”, and almost every pre-trained backbone in a model zoo has an ImageNet number attached. ImageNet-21k is the larger hierarchy from which ImageNet-1k was drawn; Ridnik et al. [5] made pre-training on it practical with a cleaned, semantic-hierarchy-aware recipe.
Evaluation benchmarks
Plain version. Training data teaches; evaluation data examines. A model that only ever sat one exam may have learned that exam. So modern papers grade a backbone on a battery of test sets, each built to probe one thing: the original distribution, a fresh sample of it, corrupted or stylized images, unusual viewpoints, fine-grained categories, small labelled budgets or rare classes.
The evaluation sets you will meet most often fall into five groups:
- In distribution. The ImageNet-1k validation set [2] is the de facto test set; ImageNet-ReaL [8] re-labels the same images with multiple labels per image.
- A fresh sample. ImageNetV2 [7] repeats the original collection process to build new test images.
- Distribution shift. ImageNet-C [42] adds synthetic corruptions, ImageNet-R [43] contains renditions such as art and cartoons, ImageNet-A [44] collects natural photos that fool a ResNet-50, ImageNet-Sketch [63] contains sketches, and ObjectNet [64] shows objects at unusual rotations, backgrounds and viewpoints.
- Long tail and fine grain. ImageNet-LT [73] trains on a long-tailed subset and tests on balanced data; iNaturalist [6], CUB-200-2011 [65] and Stanford Cars [66] test fine-grained recognition.
- Transfer. Suites such as the 12 datasets of Kornblith et al. [33] and VTAB [72] measure how well frozen or fine-tuned features adapt to small, specialized tasks.
Two practical warnings. Several fine-grained benchmarks report mean per-class accuracy instead of plain accuracy, so do not mix the two in one comparison. And image–text models such as CLIP [40] are often evaluated zero-shot, without any training on the target data: prompt wording then becomes a hyperparameter that must not be tuned on the test set, and web-scale pre-training data may already contain the test images.
Optional: Evaluation benchmarks in detail (in the Supplementary notes). The size, purpose and usual metric of each benchmark, the two transfer suites, and the zero-shot results reported for CLIP.
How reliable are the numbers?
Three lines of work changed how we read ImageNet accuracy. Rebuilding the test set by the original procedure (ImageNetV2 [7]) lowered every model’s accuracy but largely kept their ranking. Re-labelling studies [8], [9] showed that single labels and label errors can change which model looks best. And every dataset has its own bias in viewpoint and background, so test on independently collected data whenever possible.
Optional: How reliable are ImageNet numbers? (in the Supplementary notes). The size of the ImageNetV2 drop and what the re-labelling studies found.
Evaluation protocol
A benchmark number is only as honest as the protocol behind it.
- Three splits, three jobs. Fit parameters on the training set. Choose hyperparameters, early stopping, temperature, thresholds and prompts on a validation set (or by cross-validation inside the training data). Touch the test set once, at the end. When a benchmark only publishes a validation split, as with ImageNet-1k, hold out part of the training set for tuning.
- Never tune on the test set. Every decision made after looking at test results (an extra augmentation, another epoch, a different checkpoint) fits the test set a little. Repeated over a field’s worth of papers, this is test-set reuse, or adaptive overfitting to a benchmark. ImageNetV2 [7] found that ranking was largely preserved on a fresh sample, which is reassuring, but the same study also shows that absolute numbers do not transfer and that a fresh test set is the only direct check.
- Report variation. Train with several random seeds (at least three, more for small datasets) and report mean ± standard deviation, or a confidence interval. With 10,000 test images, ImageNetV2 [7] quotes 95% intervals of about ±1%; a 0.3-point gain on such a set is not a result.
- Report the whole recipe. Resolution, number of crops, extra data, distillation, which variant of a metric (top-1 or mean per-class accuracy, which AP definition) and which version of a label set (original or ReaL).
CNN architectures and the reasons behind them
Plain version. Each famous CNN fixed one specific problem of its predecessors: training too slow, too many parameters, too hard to optimize when deep, too expensive on a phone. Knowing the problem each one solved is more useful than memorizing their layer tables.
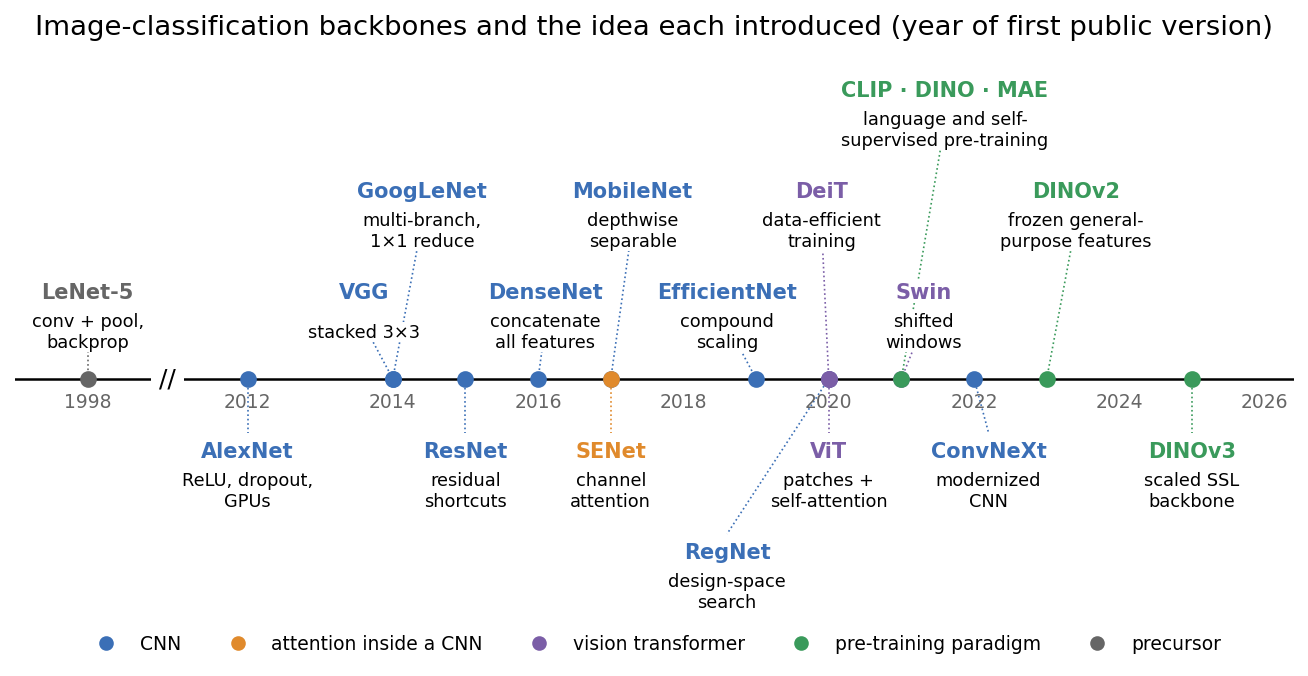
AlexNet: depth becomes trainable
Before 2012, the best ImageNet systems used hand-crafted features (SIFT, Fisher vectors) with linear classifiers. AlexNet [10] was a five-convolution, three-fully-connected network trained end to end on ImageNet. Three ingredients made it work at that scale. ReLU activations, , do not saturate for positive inputs, so gradients do not vanish the way they do with tanh, and the paper reports several times faster training. Dropout in the large fully connected layers fought overfitting; those layers held most of the parameters. GPUs made it feasible: the model was split across two GPUs. Heavy data augmentation (random crops and flips, color perturbation) was the fourth, often forgotten, ingredient. The design lesson: with enough data and compute, learned features beat engineered ones.
VGG: small kernels, stacked
VGG [11] asked a cleaner question: what happens if we only use convolutions and go deeper (16–19 weight layers)? Two stacked layers see a region; three see . For input and output channels,
ignoring biases. So the stack has fewer parameters for the same receptive field, and it inserts an extra nonlinearity between the two layers. VGG’s uniform design made it a favourite feature extractor for years. Its weakness is cost: the fully connected head and the wide early layers make it heavy.
GoogLeNet / Inception: width, branches and bottlenecks
GoogLeNet [12] attacked cost instead. Each Inception module runs , , convolutions and pooling in parallel and concatenates the outputs, so the next layer can choose the right scale. Running big kernels on many channels would be expensive, so convolutions first reduce the channel count. A convolution is a per-pixel linear map across channels: it mixes channels without looking at neighbours, and it is the cheapest way to change width. GoogLeNet also replaced the large fully connected head with global average pooling. The follow-up Inception-v3 paper [13] factorized large kernels into stacks or into and pairs, and introduced label smoothing, which we meet again in the training section.
ResNet: learning residuals
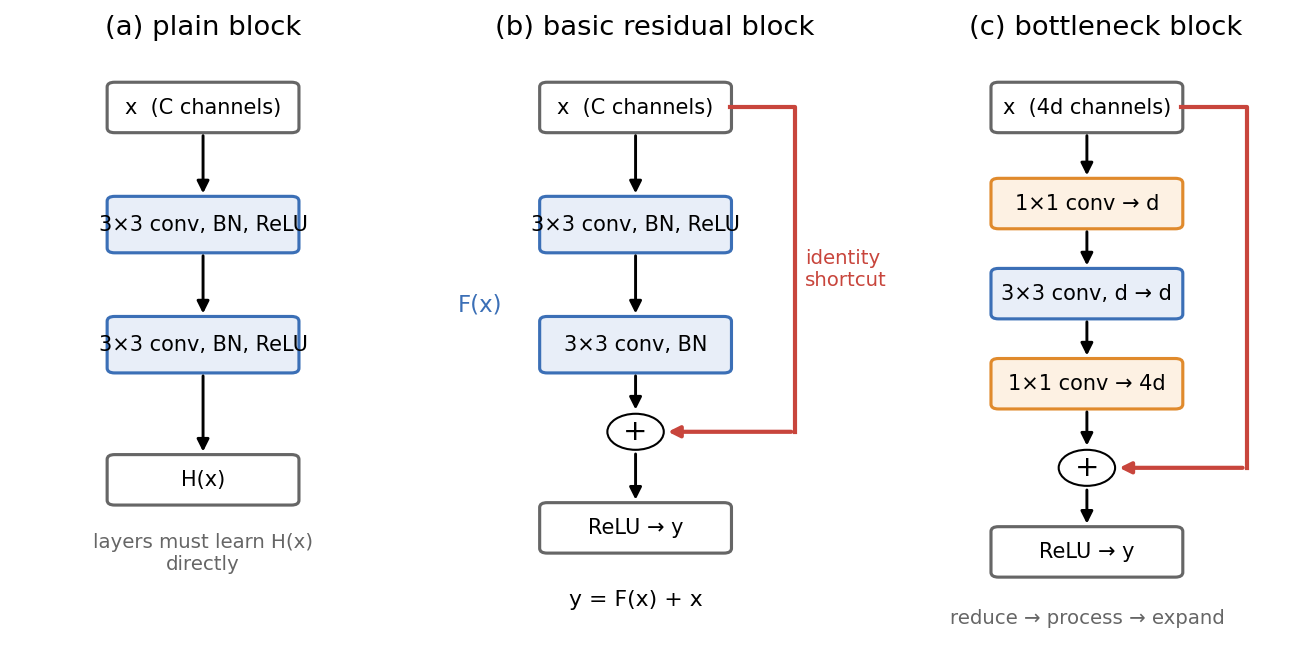
The problem. Stacking more plain layers eventually made networks worse, even on the training set. This “degradation” is an optimization problem, not overfitting: a deeper network could in principle copy a shallower one and set the extra layers to identity, yet SGD did not find that solution.
The idea. He et al. [14] let a block learn a residual and add its input back:
where is the block input, is two or three convolution layers with weights , and the output. If the best mapping is close to identity, the block only has to push toward zero, which is easy. When the shapes differ (more channels, stride 2), the shortcut becomes a projection.
Why it trains. Because every block adds its input back, the output of a deep stack equals the input of any earlier block plus a sum of residuals. The gradient of the loss therefore has a direct path through the shortcuts to every block, so it cannot vanish through a long product of small factors. A follow-up paper [15] also found that keeping the shortcut a pure identity (moving BN and ReLU into the residual branch, “pre-activation”) makes even deeper networks easier to train.
Optional: Why residual networks train: the unrolled gradient (in the Supplementary notes). The two-line derivation behind this argument.
Optional: Batch normalization (a supplementary note in DLCV 01). What the BN layer used throughout this page computes, and why training and inference use different statistics.
The bottleneck. For deeper ResNets (50 layers and up) each block becomes (reduce) → → (expand), shown in Figure 4(c). At 256 channels, a basic block of two convolutions has M weights; a bottleneck that reduces to 64 channels has k. The expensive runs on a thin tensor, which is what makes 50–152 layers affordable.
The basic block used in this tutorial’s experiments, written in PyTorch:
Code · Python · 18 lines
import torch.nn as nn
import torch.nn.functional as F

class BasicBlock(nn.Module):
    def __init__(self, cin, cout, stride=1):
        super().__init__()
        self.conv1 = nn.Conv2d(cin, cout, 3, stride, 1, bias=False)
        self.bn1 = nn.BatchNorm2d(cout)
        self.conv2 = nn.Conv2d(cout, cout, 3, 1, 1, bias=False)
        self.bn2 = nn.BatchNorm2d(cout)
        self.short = nn.Identity()
        if stride != 1 or cin != cout:   # projection shortcut when shapes change
            self.short = nn.Sequential(nn.Conv2d(cin, cout, 1, stride, bias=False), nn.BatchNorm2d(cout))

    def forward(self, x):
        out = F.relu(self.bn1(self.conv1(x)))
        out = self.bn2(self.conv2(out))
        return F.relu(out + self.short(x))   # y = F(x) + x
Two later CNN designs refine these ideas. DenseNet [16] gives each layer in a block the concatenated outputs of all earlier layers, which reuses features with few parameters but costs memory. RegNet [19] studied whole populations of ResNet-like networks and found that good ones follow simple rules for how width grows from stage to stage.
Optional: Two more CNN designs: DenseNet and RegNet (in the Supplementary notes). How each design works and the lesson it teaches.
MobileNet: factorize the convolution
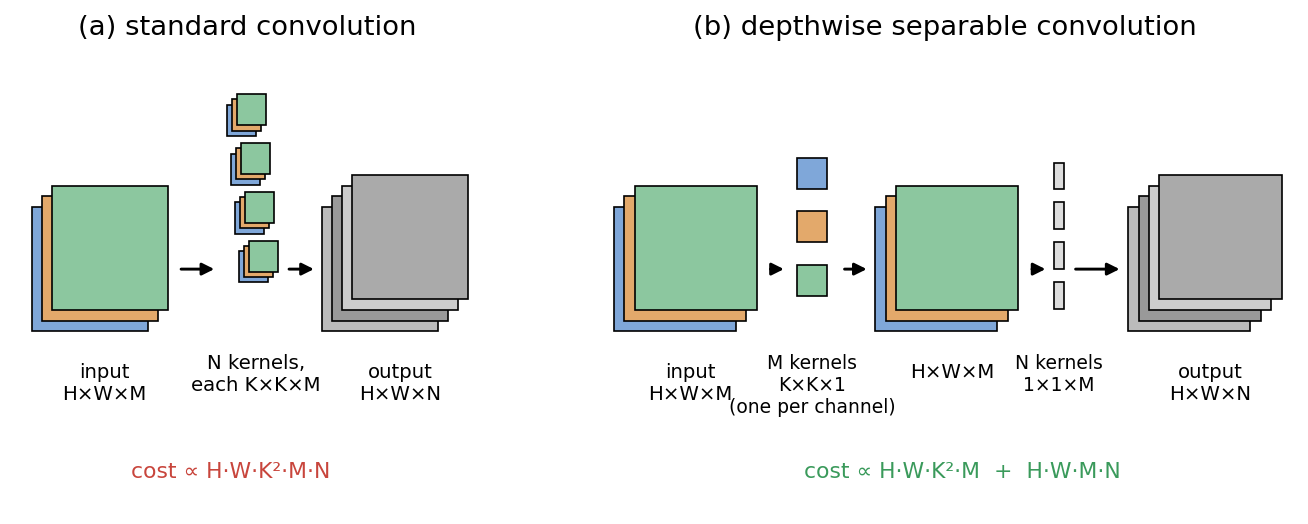
MobileNet [17] targets phones. A standard convolution from to channels on an map costs multiply–adds. A depthwise separable convolution splits it into a depthwise convolution that filters each channel separately () and a pointwise convolution that mixes channels (). The cost ratio is
so with and many output channels the separable version is roughly 8–9 times cheaper. The bet is that spatial filtering and channel mixing do not need to be learned jointly. That bet held up so well that depthwise convolutions reappear in EfficientNet and ConvNeXt.
Code · Python · 12 lines
import torch.nn as nn

def n_params(m):
    return sum(p.numel() for p in m.parameters())

M, N, K = 128, 128, 3
standard = nn.Conv2d(M, N, K, padding=1, bias=False)
separable = nn.Sequential(nn.Conv2d(M, M, K, padding=1, groups=M, bias=False),   # depthwise
                          nn.Conv2d(M, N, 1, bias=False))                          # pointwise
print("standard:", n_params(standard), " separable:", n_params(separable),
      f" ratio {n_params(separable) / n_params(standard):.3f} vs 1/N + 1/K^2 = {1/N + 1/K**2:.3f}")
# standard: 147456  separable: 17536  ratio 0.119 vs 1/N + 1/K^2 = 0.119
EfficientNet: scale depth, width and resolution together
Given a good small network, how should we make it bigger? Deeper, wider, or higher input resolution? Tan and Le [18] argued these interact: a higher resolution image needs more depth (larger receptive field) and more width (finer patterns). Compound scaling grows all three with one coefficient :
where , , multiply depth, width and resolution. FLOPs scale roughly as , so each unit increase of roughly doubles the cost. The constants are found by a small grid search on the base network (itself found by architecture search, using inverted-bottleneck blocks with depthwise convolutions and squeeze-and-excitation). The idea, “scale in a balanced way”, outlived the specific constants.
ConvNeXt: a CNN modernized step by step
After vision transformers took over the leaderboards, Liu et al. [20] asked how much of their advantage came from attention and how much from everything else. They started from a ResNet-50 trained with a transformer-style recipe and changed one thing at a time: stage ratios like Swin’s, a “patchify” stem (a stride-4 convolution), depthwise convolutions with larger kernels, an inverted bottleneck, fewer activations and normalizations, GELU and LayerNorm. The result, ConvNeXt, matched Swin-style transformers of similar cost on ImageNet and downstream tasks. The lesson: architecture families matter less than the many small design and training choices that come with them.
Attention and transformers
Plain version. A convolution only looks at a small neighbourhood with fixed weights. Attention lets each position decide, based on content, which other positions to listen to. Vision transformers apply this to image patches.
Attention first entered CNNs in a light form. The squeeze-and-excitation (SE) block [21] summarizes each channel of a feature map by its global average, and a tiny network turns these summaries into weights between 0 and 1 that rescale the channels. The network can then emphasise, say, “fur” channels when the whole image looks like an animal. SE blocks are part of EfficientNet and many mobile networks.
Optional: Squeeze-and-excitation: attention inside a CNN (in the Supplementary notes). The SE formula and a few lines of PyTorch.
ViT: an image as a sequence of patches
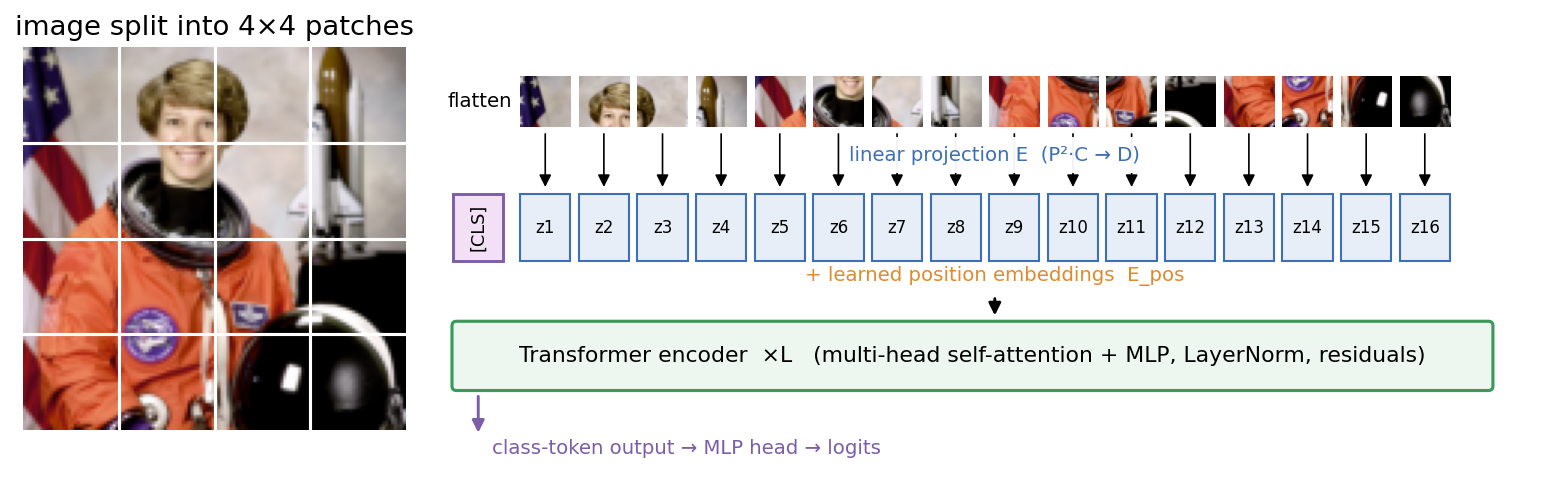
The Vision Transformer [22] removes convolutions almost entirely. An image is cut into non-overlapping patches. Each patch is flattened and linearly projected to a -dimensional token. A learnable class token is prepended and learnable position embeddings are added:
where is the -th flattened patch, the patch embedding and the position embeddings. A stack of standard transformer encoder layers (multi-head self-attention and MLP, each with LayerNorm and a residual connection) processes the sequence, and a small head reads the final class token to produce logits. Self-attention for one head is
with , , linear projections of the token matrix , and the key dimension. The attention matrix is : every patch can attend to every other patch from the first layer, so the receptive field is global immediately.
Code · Python · 23 lines
import torch
import torch.nn as nn

B, C, H, W, P, D = 2, 3, 32, 32, 8, 64
img = torch.randn(B, C, H, W)

# 1) patchify: (B, C, H, W) -> (B, N, P*P*C) with N = (H/P)*(W/P)
patches = img.unfold(2, P, P).unfold(3, P, P)                 # (B, C, H/P, W/P, P, P)
patches = patches.permute(0, 2, 3, 1, 4, 5).reshape(B, -1, C * P * P)
N = patches.shape[1]

# 2) linear patch embedding + class token + learned position embedding
embed = nn.Linear(C * P * P, D)          # same as nn.Conv2d(C, D, kernel_size=P, stride=P)
cls = nn.Parameter(torch.zeros(1, 1, D))
pos = nn.Parameter(torch.randn(1, N + 1, D) * 0.02)
z = torch.cat([cls.expand(B, -1, -1), embed(patches)], dim=1) + pos   # (B, N+1, D)

# 3) one head of scaled dot-product self-attention
Wq, Wk, Wv = (nn.Linear(D, D, bias=False) for _ in range(3))
q, k, v = Wq(z), Wk(z), Wv(z)
A = (q @ k.transpose(1, 2) / D ** 0.5).softmax(dim=-1)        # (B, N+1, N+1), rows sum to 1
out = A @ v
print("tokens:", N + 1, " attention:", tuple(A.shape), " class-token output:", tuple(out[:, 0].shape))
Why ViT needs data. A CNN has built-in assumptions, called inductive biases: locality (a pixel mostly relates to its neighbours) and translation equivariance (the same filter everywhere). ViT has almost none; apart from patch extraction and position embeddings, it must learn spatial structure from data. The ViT paper [22] reports that, trained on ImageNet-1k alone, ViTs fell behind comparable ResNets, but pre-trained on much larger datasets (ImageNet-21k or the 300M-image JFT) they matched or beat them. Weak priors cost data at small scale and stop limiting the model at large scale. The same paper also tried hybrid models, feeding the feature map of a ResNet stem into the transformer instead of raw patches; hybrids helped at small compute budgets and the gap closed as models grew.
DeiT: training ViTs on ImageNet alone
DeiT [23] showed that the “ViT needs huge data” conclusion was partly a statement about recipes. With strong augmentation (RandAugment, Mixup, CutMix, random erasing), stochastic depth, repeated augmentation and AdamW, a ViT-B trained only on ImageNet-1k reached 83.1% top-1. DeiT also added a distillation token: a second learnable token, like the class token, whose output is trained to match a teacher network’s predictions (they found a convnet teacher worked best), while the class token is trained on the true label. This is a transformer-specific form of knowledge distillation [51]. At test time the two heads’ outputs are combined.
Optional: Knowledge distillation (a supplementary note in DLCV 01). The distillation loss and the role of the temperature.
Swin: windows, shifts and a hierarchy
Global attention costs grow quadratically with the number of tokens, which is a problem for high-resolution inputs and for dense tasks. Swin [24] computes attention only inside non-overlapping windows, and shifts the window grid by half a window in alternating layers so information crosses window borders. Token count is reduced between stages by merging neighbouring patches, giving a CNN-like pyramid with strides 4, 8, 16, 32. For an token map with channels, the paper gives
so windowed attention is linear in the number of tokens for a fixed window size . Swin brought back two CNN priors, locality and hierarchy, and became a general-purpose backbone for detection and segmentation as well as classification. The broad landscape of vision transformers is surveyed by Khan et al. [25].
Training recipes
Plain version. The same network can gain or lose several points of accuracy depending on how it is trained. A modern recipe is a bundle of small tricks that each make memorizing harder or optimization smoother.
Data augmentation
- Random resized crop samples a crop covering a random fraction of the image area and a random aspect ratio, then resizes it to the training resolution. It teaches scale and position invariance and is the default for ImageNet training. Horizontal flips are added when they are label-preserving (they are for most photos, not for text or digits).
- Mixup [26] blends two images and their labels: and , with and one-hot. It encourages linear behaviour between training examples.
- CutMix [27] pastes a random rectangle from image into image and mixes the labels in proportion to the pasted area. Unlike Mixup, every pixel stays natural, and the network must recognize objects from partial views.
- RandAugment [28] replaces learned augmentation policies with two numbers: apply random operations (rotate, shear, posterize, contrast, …) at a shared magnitude . Its paper reports that this tiny search space matches or beats earlier automated policies, and that the right strength depends on model and dataset size.
Code · Python · 25 lines
import numpy as np
import torch
import torch.nn.functional as F

def mixup(x, y, num_classes, alpha=0.2):
    lam = float(np.random.beta(alpha, alpha))
    idx = torch.randperm(x.size(0))
    y1 = F.one_hot(y, num_classes).float()
    return lam * x + (1 - lam) * x[idx], lam * y1 + (1 - lam) * y1[idx]

def cutmix(x, y, num_classes, alpha=1.0):
    lam = float(np.random.beta(alpha, alpha))
    idx = torch.randperm(x.size(0))
    H, W = x.shape[-2:]
    h, w = int(H * np.sqrt(1 - lam)), int(W * np.sqrt(1 - lam))
    cy, cx = np.random.randint(H), np.random.randint(W)
    y0, y1_, x0, x1_ = max(cy - h // 2, 0), min(cy + h // 2, H), max(cx - w // 2, 0), min(cx + w // 2, W)
    x = x.clone()
    x[..., y0:y1_, x0:x1_] = x[idx][..., y0:y1_, x0:x1_]
    lam = 1 - (y1_ - y0) * (x1_ - x0) / (H * W)            # actual area kept
    y1 = F.one_hot(y, num_classes).float()
    return x, lam * y1 + (1 - lam) * y1[idx]

def soft_ce(logits, soft_targets):
    return -(soft_targets * logits.log_softmax(1)).sum(1).mean()
Label smoothing
Cross-entropy with one-hot targets keeps pushing the true logit up forever; the loss only reaches zero at infinite margin. Label smoothing [13] replaces the target with
where (often 0.1) is the smoothing strength, the one-hot vector and the all-ones vector. The optimum is now a finite logit gap, which regularizes the network and usually reduces overconfidence. In PyTorch it is one argument: F.cross_entropy(logits, y, label_smoothing=0.1).
Optimizer, schedule and regularizers
- AdamW [29] decouples weight decay from the adaptive gradient step: instead of adding to the gradient (which Adam then rescales per parameter), it shrinks the weights directly, , where is the learning rate, Adam’s moment estimates and the decay. It is the default for transformers and for modern CNN recipes. Biases and normalization parameters are usually excluded from decay.
- Warmup + cosine schedule. Large learning rates are unstable in the first steps, when normalization statistics and Adam’s moment estimates are still poor, so the learning rate rises linearly for a few epochs. It then follows a half cosine down to near zero, with the step after warmup and the remaining steps, an idea popularized by SGDR [30].
- Stochastic depth [31] randomly skips whole residual branches during training (the block becomes identity), with a skip probability that grows with depth. It shortens the effective depth during training and acts like an ensemble of shallower networks.
- EMA of weights keeps an exponential moving average (with close to 1, e.g. 0.999) and evaluates . It smooths out the noise of the last SGD steps.
Code · Python · 20 lines
import math
import torch

def warmup_cosine(step, total, warmup):
    if step < warmup:
        return (step + 1) / warmup                      # linear warmup
    p = (step - warmup) / max(1, total - warmup)
    return 0.5 * (1 + math.cos(math.pi * p))            # cosine decay to 0

model = torch.nn.Linear(10, 3)
decay = [p for n, p in model.named_parameters() if p.ndim > 1]      # weights
no_decay = [p for n, p in model.named_parameters() if p.ndim <= 1]  # biases, norm scales
opt = torch.optim.AdamW([{"params": decay, "weight_decay": 0.05},
                         {"params": no_decay, "weight_decay": 0.0}], lr=1e-3)
total = 1000
sched = torch.optim.lr_scheduler.LambdaLR(opt, lambda s: warmup_cosine(s, total, warmup=50))
ema = torch.optim.swa_utils.AveragedModel(model, multi_avg_fn=torch.optim.swa_utils.get_ema_multi_avg_fn(0.999))
for step in range(total):
    loss = model(torch.randn(16, 10)).pow(2).mean()
    opt.zero_grad(); loss.backward(); opt.step(); sched.step(); ema.update_parameters(model)
A small experiment
To see the pieces working together, we trained a 78k-parameter ResNet (“TinyResNet”: a stem, three basic blocks with 16, 32 and 64 channels, global average pooling) on scikit-learn’s digits, upsampled to so that the strided stages have room to work. To make overfitting visible we used only 100 training images, 500 images for calibration and 1,197 for testing, with AdamW (weight decay 0.05), batch size 32, 40 epochs and two epochs of warmup before a cosine decay. One run used no augmentation. The other used random rotation (±15°), scaling and shifts (a random-resized-crop-like affine; no flips, since a flipped digit is a different symbol) together with label smoothing 0.1. All code is in scripts/figures/dl_02_image_classification.py and runs on a CPU in about a minute.
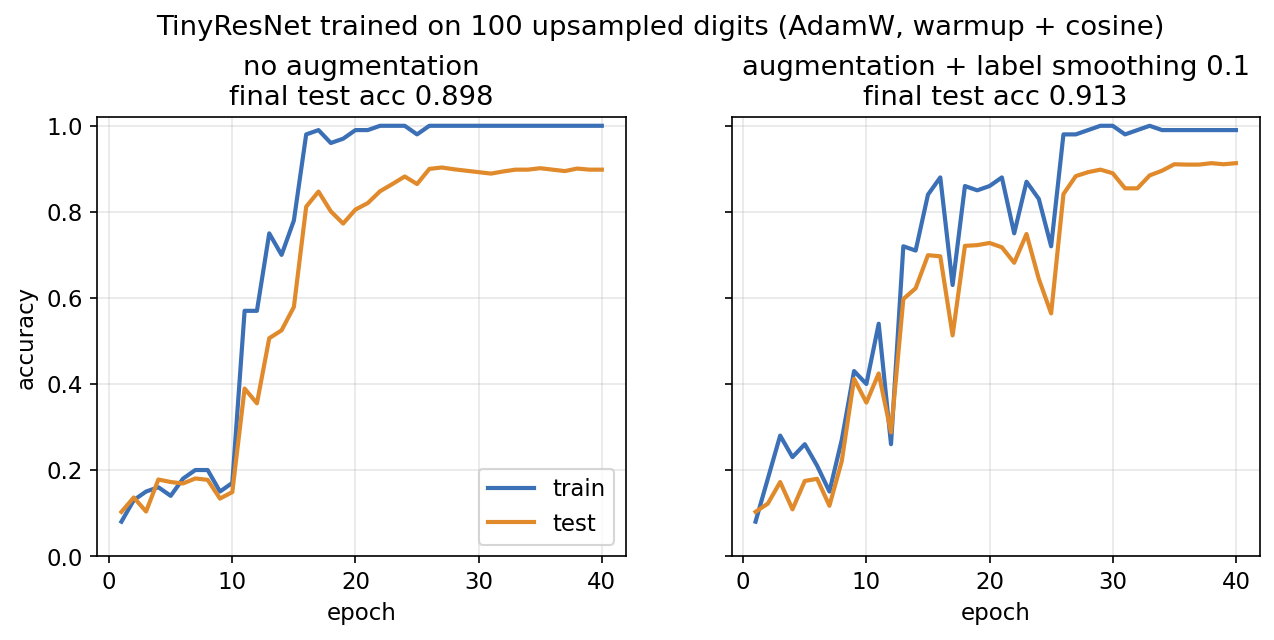
The no-augmentation model reaches 100% training accuracy after about twenty epochs: with 100 images, memorization is easy. The augmented model sees a slightly different version of each digit every epoch, learns more slowly, and generalizes a little better (91.3% against 89.8%). Do not read too much into 1.5 points on one seed; the point is the mechanism.
“ResNet strikes back”
The most striking evidence for recipes comes from Wightman, Touvron and Jégou [32]. They kept the 2015 ResNet-50 architecture fixed and retrained it with a modern recipe: random resized crops and flips, RandAugment, Mixup and CutMix, the LAMB optimizer with a cosine schedule, a binary cross-entropy loss and longer training. The vanilla ResNet-50 reached 80.4% top-1 on ImageNet at without extra data or distillation, against 76.1% for the standard torchvision weights they compare with. Two consequences follow. First, many “new architecture beats ResNet-50” claims compared a new model with a modern recipe against an old model with an old recipe. Second, when you compare architectures, train them with the same, tuned recipe, as ConvNeXt [20] and RegNet [19] did.
Transfer learning and fine-tuning
Plain version. Training a backbone from scratch needs a lot of data. Instead, start from a network already trained on a big dataset and adapt it to your task. You can either keep its features frozen and train only a new last layer, or gently retrain everything.
Let be a pre-trained backbone that maps an image to a feature vector , and a new linear head.
- Linear probe. Freeze and train only (a logistic regression on fixed features). It is cheap, needs few labels, and is the standard way to measure how good a representation is.
- Full fine-tuning. Update and together, usually with a learning rate for the backbone 10–100 times smaller than for the head, a short warmup, and sometimes layer-wise learning-rate decay (smaller rates for earlier layers). It adapts the features to the new domain and usually wins when there is enough labelled data.
- In between lie partial fine-tuning (only the last stages), and parameter-efficient methods that add small trainable modules to a frozen backbone.
Kornblith et al. [33] measured how ImageNet accuracy predicts transfer performance. For fine-tuning, better ImageNet models generally transferred better, with a strong correlation. For fixed features, the correlation was weaker and depended on regularization choices: some settings that improved ImageNet accuracy (for example, label smoothing and dropout) produced worse frozen features for other tasks. A good classifier and a good feature extractor are related, but not the same thing.
Code · Python · 17 lines
import torch
import torch.nn as nn

backbone = nn.Sequential(nn.Conv2d(3, 32, 3, 2, 1), nn.ReLU(), nn.Conv2d(32, 64, 3, 2, 1), nn.ReLU(),
                         nn.AdaptiveAvgPool2d(1), nn.Flatten())          # stand-in for a pre-trained model
head = nn.Linear(64, 5)

# linear probe: freeze the backbone, train only the head
for p in backbone.parameters():
    p.requires_grad = False
probe_opt = torch.optim.AdamW(head.parameters(), lr=1e-3)

# full fine-tuning: unfreeze, use a smaller learning rate for the backbone than for the head
for p in backbone.parameters():
    p.requires_grad = True
ft_opt = torch.optim.AdamW([{"params": backbone.parameters(), "lr": 1e-5},
                            {"params": head.parameters(), "lr": 1e-3}], weight_decay=0.05)
Self-supervised and foundation-model classifiers
Plain version. Labels are expensive; images are not. Self-supervised learning invents a task whose answer is in the image itself (are these two crops from the same photo? what was under this mask?), learns features by solving it, and only then uses a few labels.
Contrastive learning: SimCLR and MoCo
Contrastive methods pull together the embeddings of two augmented views of the same image and push apart views of different images. In SimCLR [34], each view must pick out its partner among all the other views in the batch, a classification task whose “wrong answers” are the other images; strong augmentation (especially cropping plus color distortion) and large batches turned out to be essential. MoCo [35] gets many negatives without huge batches by keeping a queue of embeddings produced by a slowly updated copy of the encoder.
Optional: Contrastive learning in detail: SimCLR and MoCo (in the Supplementary notes). The InfoNCE loss with every symbol defined, and how MoCo’s momentum encoder works.
DINO and DINOv2: self-distillation
DINO [36] drops explicit negatives. A student network sees several crops (including small local ones) and is trained to match the output distribution of a teacher that sees global crops. The teacher is an EMA of the student; centering and sharpening of the teacher outputs prevent collapse to a constant. With ViTs, DINO features showed striking properties: the class token’s attention maps segment objects without any segmentation labels, and a simple -NN classifier on frozen features works well. DINOv2 [38] scaled the approach with an automatically curated dataset and a large ViT distilled into smaller ones, producing general-purpose frozen features that work across classification, segmentation and depth without fine-tuning. DINOv3 [39] continued the scaling and introduced “Gram anchoring” to keep dense patch features from degrading during long training.
MAE: masked image modeling
MAE [37] borrows the masked-language-model idea. It masks a large fraction of patches (75% in the paper), feeds only the visible patches to a ViT encoder, and asks a light decoder to reconstruct the missing pixels. Because the encoder skips masked tokens, pre-training is cheap. MAE features are less linearly separable than contrastive ones (linear probes are weaker), but they fine-tune very well. This is a recurring pattern: different pre-training objectives favour different adaptation methods.
CLIP: zero-shot classification with language
CLIP [40] trains an image encoder and a text encoder on hundreds of millions of image–caption pairs with a symmetric contrastive loss, so that matching pairs have high cosine similarity. A classifier is then built without any training images: write a prompt per class, such as a photo of a dog., embed it, and predict
where is the prompt for class . The text embeddings act as the weights of a linear classifier, computed from words. The paper reports that zero-shot CLIP matched the accuracy of a ResNet-50 trained on ImageNet’s 1.28M labelled images, and that averaging several prompt templates (“a photo of a …”, “a blurry photo of a …”) helps. Zero-shot accuracy depends strongly on prompt wording, on whether the class names are visually meaningful, and on how well the web data covers the domain.
Robustness and evaluation pitfalls
Plain version. A classifier that scores 90% on its test set may fail badly when the photos come from a different camera, when someone adds invisible noise on purpose, or when the “easy clue” it learned (backgrounds, watermarks) is missing. And even when it is right, its confidence may be wrong.
Distribution shift: ImageNet-C, -R and -A
Hendrycks and colleagues built three widely used shifted test sets for ImageNet classifiers. ImageNet-C [42] applies 15 algorithmic corruptions (noise, blur, weather, digital artefacts) at five severities and summarizes the error relative to a baseline (mean corruption error). ImageNet-R [43] collects renditions (art, cartoons, sculptures, sketches, toys) of 200 ImageNet classes and tests whether a model understands shape and concept rather than photographic texture. ImageNet-A [44] contains natural, unmodified photos that were filtered to fool a ResNet-50; standard models do very poorly on it. These sets reveal different weaknesses, and improving one does not guarantee improving the others. Large-scale pre-training (as in CLIP and DINOv2) tends to improve robustness to such natural shifts much more than architecture changes at fixed data.
Adversarial examples: FGSM
Goodfellow et al. [45] explained adversarial examples by the linearity of networks in high dimensions: a tiny change to every input dimension, aligned with the weights, adds up to a large change in the output. The fast gradient sign method perturbs an input in one step:
where bounds the change per pixel ( norm), is the loss and keeps pixels in the valid range.
Code · Python · 6 lines
import torch.nn.functional as F

def fgsm(model, x, y, eps):
    x = x.clone().requires_grad_(True)
    F.cross_entropy(model(x), y).backward()
    return (x + eps * x.grad.sign()).clamp(-1, 1).detach()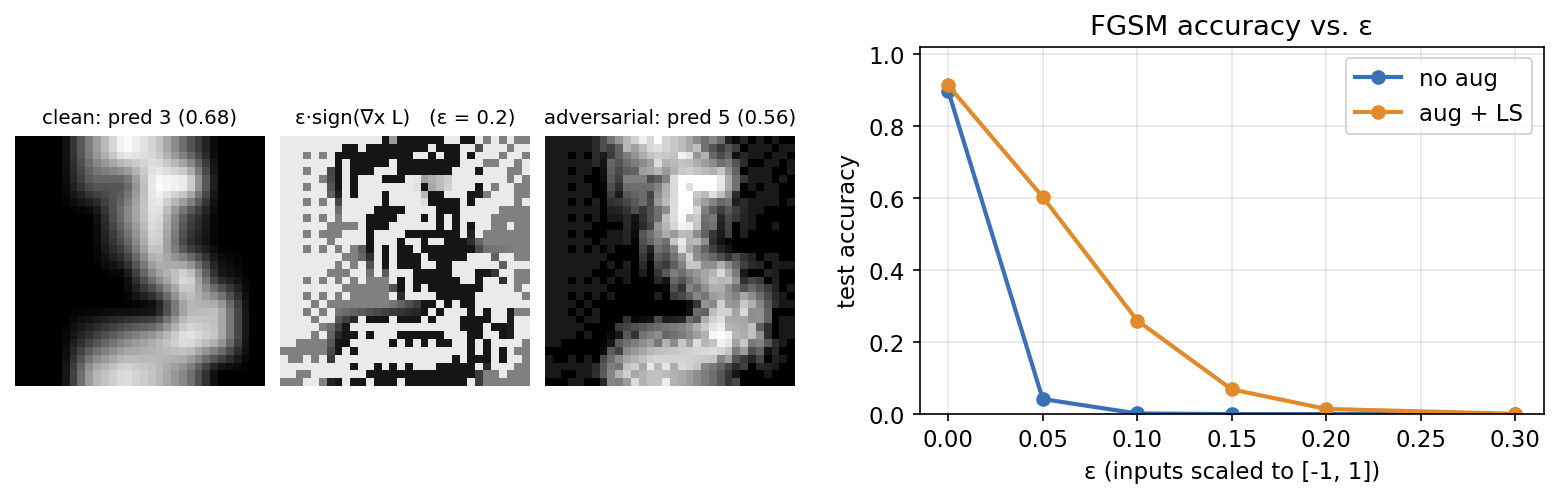
Two cautions about Figure 8. First, the augmented model looks more robust at small , but label smoothing is known to flatten the loss surface around training points, which can weaken one-step gradient attacks without giving real robustness; stronger iterative attacks are the proper test. Second, on a scale is visible on an 8×8 digit; on natural images, imperceptible perturbations already fool standard ImageNet models.
Shortcut learning
Geirhos et al. [46] collect many failures under one name: shortcut learning. A network minimizes the training loss with whatever cue is easiest, which is often not the cue we intended: background instead of animal, hospital tag instead of pathology, texture instead of shape. Shortcuts look fine on an i.i.d. test set, because the same shortcut exists there. They fail under distribution shift. The prescription is to test out of distribution on purpose, design tests that break the suspected shortcut, and use interpretability tools such as Grad-CAM (below) to check what the model attends to.
Calibration and temperature scaling
Temperature scaling [47] divides all logits by one scalar before the softmax, . is fitted by minimizing the negative log-likelihood on a held-out calibration split (never the test set). softens overconfident predictions; sharpens underconfident ones. Because dividing by does not change the argmax, accuracy is unchanged.
Code · Python · 32 lines
import torch
import torch.nn.functional as F

def fit_temperature(logits, y, iters=300):
    """Learn one scalar T > 0 on a held-out calibration split."""
    log_t = torch.zeros(1, requires_grad=True)
    opt = torch.optim.Adam([log_t], lr=0.05)
    for _ in range(iters):
        loss = F.cross_entropy(logits / log_t.exp(), y)
        opt.zero_grad(); loss.backward(); opt.step()
    return log_t.exp().item()

def ece(probs, y, n_bins=10):
    conf, pred = probs.max(1)
    correct = (pred == y).float()
    edges = torch.linspace(0, 1, n_bins + 1)
    total = 0.0
    for lo, hi in zip(edges[:-1], edges[1:]):
        m = (conf > lo) & (conf <= hi)
        if m.any():
            total += m.float().mean() * (correct[m].mean() - conf[m].mean()).abs()
    return float(total)

# toy check: an over-confident "model" = true logits multiplied by 3
torch.manual_seed(0)
true_logits = torch.randn(4000, 10)
y = torch.distributions.Categorical(logits=true_logits).sample()
over = 3 * true_logits
T = fit_temperature(over[:2000], y[:2000])
print(f"T = {T:.2f}  ECE {ece(over[2000:].softmax(1), y[2000:]):.3f} -> "
      f"{ece((over[2000:] / T).softmax(1), y[2000:]):.3f}")
# T = 2.90  ECE 0.345 -> 0.018
In this toy check the logits are three times too large, and the fitted temperature (2.90) recovers that factor. On our real TinyResNet (the model trained without augmentation), the miscalibration went the other way.
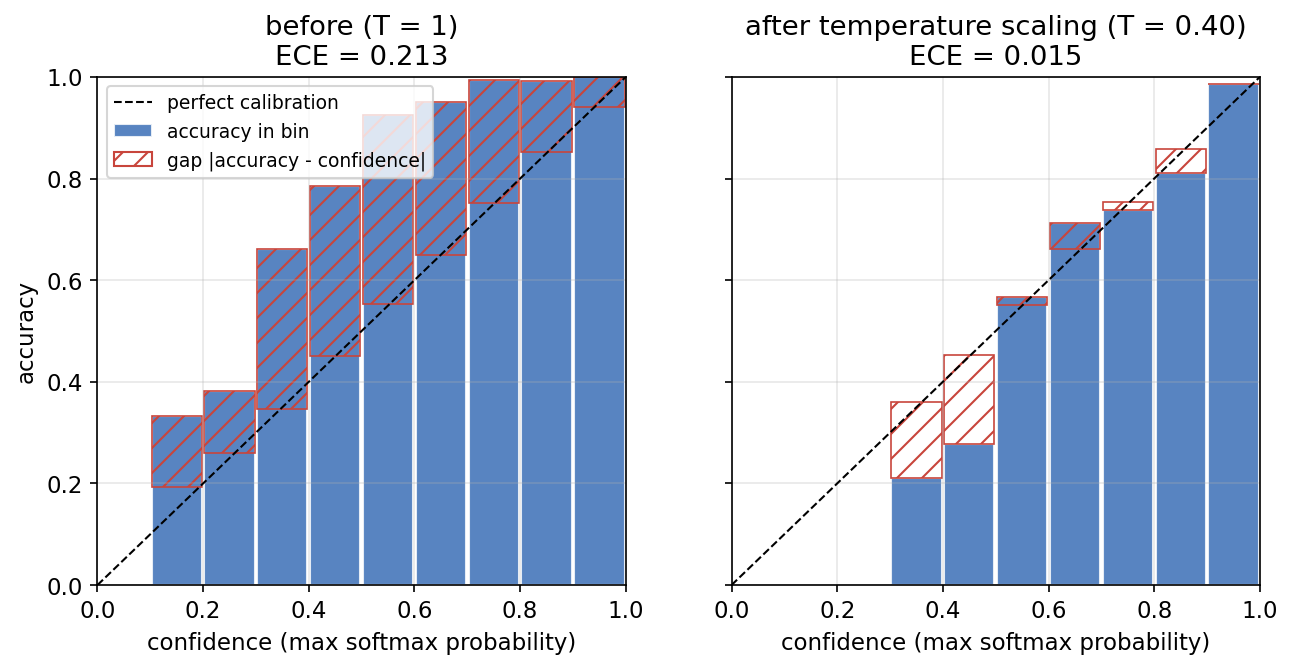
Why underconfident? Our tiny model was trained briefly with strong weight decay, which keeps logits small. Guo et al. [47] observed overconfidence in large, long-trained modern networks, and identified depth, width, batch normalization and reduced weight decay as contributing factors. Miscalibration has no fixed sign; measure it. Also note that calibration is itself fragile under distribution shift: a temperature fitted on in-distribution data does not guarantee calibrated confidence on ImageNet-C-style shifts.
Efficiency
Plain version. A model must fit the device and the time budget. Parameter count, compute, and actual speed are three different measurements, and only the last one is what users feel.
- Parameters determine model size on disk and in memory. A float32 parameter takes 4 bytes.
- FLOPs (or multiply–accumulates, MACs; one MAC is usually counted as two FLOPs) measure arithmetic per image. For a convolution with kernels, input and output channels on an output map, MACs . Compute grows with the square of resolution.
- Latency and throughput are measured on target hardware. Depthwise convolutions have few FLOPs but low arithmetic intensity, so they often run slower on GPUs than their FLOP count suggests; DenseNet’s concatenations cost memory bandwidth. Always benchmark.
- Quantization stores weights and activations as 8-bit integers instead of 32-bit floats. Jacob et al. [50] described integer-only inference with quantization-aware training, which simulates rounding during training so the network learns to tolerate it. Post-training quantization with a small calibration set is the cheap alternative.
- Distillation [51] trains a small student to match a large teacher’s soft predictions, as DeiT did with its distillation token.
Interpretability: CAM and Grad-CAM
Plain version. A heat map over the image shows which regions pushed the score for a class up. It is a sanity check, not a proof of reasoning.
Class activation mapping (CAM) [48] works for networks that end with global average pooling and one linear layer. If is the -th feature map of the last convolutional layer and the weight connecting it to class , then the class score is , and the map shows where that score comes from. Grad-CAM [49] generalizes this to any differentiable architecture by replacing the weights with spatially averaged gradients:
where is the logit of class , the activation of channel at position , and the number of positions. The ReLU keeps only regions with a positive influence on the class. The coarse map ( in our network) is upsampled to the image size.
Code · Python · 13 lines
import torch.nn.functional as F

def grad_cam(model, x, target=None):
    model.eval()
    feats = model.features(x)                          # (1, K, h, w) last conv stage
    feats.retain_grad()
    logits = model.fc(feats.mean(dim=(2, 3)))
    c = logits.argmax(1).item() if target is None else target
    logits[0, c].backward()
    alpha = feats.grad.mean(dim=(2, 3), keepdim=True)  # channel importance weights
    cam = F.relu((alpha * feats).sum(1, keepdim=True))
    cam = F.interpolate(cam, size=x.shape[-2:], mode="bilinear", align_corners=False)
    return (cam / (cam.max() + 1e-8))[0, 0].detach(), c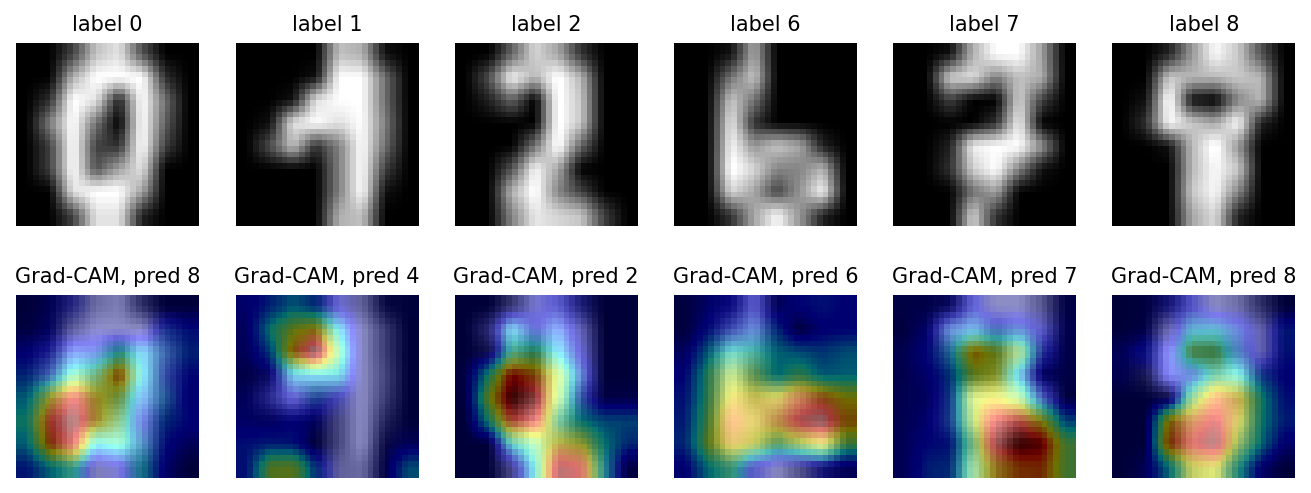
Explanations are most useful exactly when the model is wrong, as in Figure 10: they show which strokes looked like the wrong class. But treat saliency maps with care. They are coarse (limited by the last feature map’s resolution), and they explain one class score for one input, not the model’s general reasoning.
Modern view
Surveys worth reading. Li et al. [1] review CNNs from basic building blocks to advanced models, with experiments that compare activation functions, losses and optimizers. Khan et al. [25] survey vision transformers and stress their reliance on large-scale pre-training and the cost of quadratic attention. Gui et al. [41] divide self-supervised learning into context-based, contrastive, generative and hybrid methods. On benchmark reliability, the ImageNetV2 [7], re-labelling [8] and label-error [9] studies together argue for multiple test sets, multi-label evaluation and reporting variance.
Optional: Guide to the Modern view surveys (in the Paper guides). What each survey covers and how it organizes the field.
The 2023–2026 picture. Five trends define current practice.
- Pre-train once, adapt cheaply. Most new classifiers are not trained from scratch. They start from a large backbone trained with self-supervision (DINOv2 [38], DINOv3 [39]), image–text contrast (CLIP [40] and open reproductions), or masked modeling (MAE [37]), and adapt it with a linear probe, a -NN rule, or a short fine-tune.
- Zero-shot and open-vocabulary classification. Image–text models turn the label set into text. The class list can change at test time without retraining, which blurs the line between classification and retrieval.
- Scaling laws for vision. Zhai et al. [52] scaled ViTs to billions of parameters and characterized how error falls with compute, data and model size, including the observation that larger models are more sample-efficient in few-shot transfer. Cherti et al. [53] fitted reproducible power laws for open CLIP training on public data, and found that the scaling behaviour depends on the training data distribution and the downstream task.
- Architectures converged. ConvNeXt [20] and Swin [24] show that convolutions and attention, given the same recipe and scale, land in a similar place. The choice is now driven by hardware, resolution and downstream tasks (dense prediction favours hierarchical designs) more than by top-1 accuracy.
- Evaluation moved beyond ImageNet-1k top-1. Robustness suites (ImageNet-C/R/A [42]–[44] and ImageNetV2 [7]), calibration, and transfer to many downstream datasets are now standard parts of a backbone paper.
Open problems. Robustness to natural distribution shift still lags clean accuracy, and gains from robust training methods are often specific to the shift they target. Shortcut learning [46] is hard to detect without counterfactual tests. Calibration under shift is unsolved. Long-tailed and fine-grained recognition remain hard because the rare classes have the fewest examples. Benchmark saturation and label noise make small accuracy differences on ImageNet-1k uninformative. And the dominant foundation models are trained on web-scale data whose composition, licensing and biases are hard to audit, which matters directly for what a “zero-shot” classifier will and will not recognize.
Key takeaways
- Use softmax for mutually exclusive labels and independent sigmoid outputs for multi-label tasks.
- Compare backbones under matched data, training and compute; architecture names alone do not explain score differences.
- Pretraining supplies reusable features; linear probing evaluates them, while fine-tuning changes them.
- Inspect confusion matrices and per-class results; state whether averages are macro or micro.
- Fit calibration on held-out data and evaluate both confidence and accuracy.
- Test shifted data, shortcuts and efficiency separately; report multiple seeds and tune only on validation data.
Exercises
- Receptive fields and parameters. Show that three stacked convolutions (stride 1) have a receptive field. With input and output channels and no biases, compare their parameter count with a single convolution.
Hint
Each layer adds 2 pixels to the receptive field: . Parameters: versus , about 45% fewer, plus two extra nonlinearities.
- Bottleneck arithmetic. A ResNet bottleneck has input channels and reduces to . Count the weights (no biases) of the –– branch as a function of , and compare with a basic block of two convolutions at width . What is the ratio?
Hint
Bottleneck: . Basic block at width : . The ratio is , about 17 times fewer weights.
- Label smoothing optimum. For one example with classes and smoothing , assume all wrong-class logits are equal. Show that the cross-entropy with smoothed targets is minimized when the logit gap between the true class and each wrong class is . Evaluate it for , .
Hint
The minimum of cross-entropy over is at . So and every other , and the logit gap is the log of their ratio: . Without smoothing the optimal gap is infinite.
- ViT token count. A ViT with patches receives a image. How many tokens enter the encoder? If the image is fine-tuned at , how many tokens are there, by what factor does the attention-matrix size grow, and what must be done with the position embeddings?
Hint
patches plus one class token: 197. At 384: . The attention matrix grows by . The learned position embeddings form a grid; they are interpolated (2-D) to , which is what the ViT paper does when fine-tuning at higher resolution.
- Temperature does not change accuracy. Prove that for any , . Then, using
scripts/figures/dl_02_image_classification.py, fit the temperature on the test set instead of the calibration split and compare the reported ECE. Why is that number optimistic?
Hint
Division by a positive constant and the exponential are both strictly increasing, and the softmax denominator is shared. Fitting on the test set uses test labels to tune a parameter, so the reported ECE is no longer an honest estimate of performance on new data.
- Build a shortcut. Modify the digit experiment so that in the training set every “3” has a bright pixel in the top-left corner, but the test set does not. Train the TinyResNet, report test accuracy on the 3s, and look at Grad-CAM maps for a few training 3s. What do you expect, and how would you detect this problem if you did not know the shortcut was there?
Hint
The network can classify training 3s from the corner pixel alone, so test accuracy on 3s drops while training accuracy stays perfect, and Grad-CAM tends to highlight the corner. Without knowing the shortcut, look for heat maps that fall on background, evaluate on independently collected data, and run counterfactual tests (erase or move suspicious regions and see whether predictions change).
- Macro versus micro F1. A three-class model is tested on 100 images. Rows are true classes, columns predictions: class A (90 images) → 88 A, 1 B, 1 C; class B (5 images) → 3 A, 2 B, 0 C; class C (5 images) → 4 A, 0 B, 1 C. Compute per-class precision, recall and , then macro and micro . Which number would you put in a report about detecting the rare classes B and C, and why?
Hint
Column sums are 95, 3 and 2. Precision: , , . Recall: , , . Using : , , . Macro . Micro equals accuracy, . Micro is dominated by class A; macro exposes that B and C are mostly missed, so macro (plus per-class recall) is the honest number for rare classes. You can check the result with precision_recall_fscore_support(..., average="macro").
References
- Z. Li, F. Liu, W. Yang, S. Peng, and J. Zhou, “A Survey of Convolutional Neural Networks: Analysis, Applications, and Prospects,” IEEE Transactions on Neural Networks and Learning Systems, vol. 33, no. 12, pp. 6999–7019, 2022. doi:10.1109/TNNLS.2021.3084827
- O. Russakovsky, J. Deng, H. Su, J. Krause, S. Satheesh, S. Ma, et al., “ImageNet Large Scale Visual Recognition Challenge,” International Journal of Computer Vision, vol. 115, pp. 211–252, 2015. doi:10.1007/s11263-015-0816-y
- Y. LeCun, L. Bottou, Y. Bengio, and P. Haffner, “Gradient-Based Learning Applied to Document Recognition,” Proceedings of the IEEE, vol. 86, no. 11, pp. 2278–2324, 1998. doi:10.1109/5.726791
- A. Krizhevsky, “Learning Multiple Layers of Features from Tiny Images,” technical report, University of Toronto, 2009. dataset page
- T. Ridnik, E. Ben-Baruch, A. Noy, and L. Zelnik-Manor, “ImageNet-21K Pretraining for the Masses,” NeurIPS, 2021. arXiv
- G. Van Horn, O. Mac Aodha, Y. Song, Y. Cui, C. Sun, A. Shepard, et al., “The iNaturalist Species Classification and Detection Dataset,” CVPR, 2018. arXiv
- B. Recht, R. Roelofs, L. Schmidt, and V. Shankar, “Do ImageNet Classifiers Generalize to ImageNet?,” ICML, PMLR vol. 97, 2019. paper
- L. Beyer, O. J. Hénaff, A. Kolesnikov, X. Zhai, and A. van den Oord, “Are We Done with ImageNet?,” arXiv:2006.07159, 2020. arXiv
- C. G. Northcutt, A. Athalye, and J. Mueller, “Pervasive Label Errors in Test Sets Destabilize Machine Learning Benchmarks,” NeurIPS, 2021. arXiv
- A. Krizhevsky, I. Sutskever, and G. E. Hinton, “ImageNet Classification with Deep Convolutional Neural Networks,” Advances in Neural Information Processing Systems 25 (NIPS), 2012. paper
- K. Simonyan and A. Zisserman, “Very Deep Convolutional Networks for Large-Scale Image Recognition,” ICLR, 2015. arXiv
- C. Szegedy, W. Liu, Y. Jia, P. Sermanet, S. Reed, D. Anguelov, D. Erhan, V. Vanhoucke, and A. Rabinovich, “Going Deeper with Convolutions,” CVPR, 2015. doi:10.1109/CVPR.2015.7298594
- C. Szegedy, V. Vanhoucke, S. Ioffe, J. Shlens, and Z. Wojna, “Rethinking the Inception Architecture for Computer Vision,” CVPR, 2016. doi:10.1109/CVPR.2016.308
- K. He, X. Zhang, S. Ren, and J. Sun, “Deep Residual Learning for Image Recognition,” CVPR, 2016. doi:10.1109/CVPR.2016.90
- K. He, X. Zhang, S. Ren, and J. Sun, “Identity Mappings in Deep Residual Networks,” ECCV, 2016. arXiv
- G. Huang, Z. Liu, L. van der Maaten, and K. Q. Weinberger, “Densely Connected Convolutional Networks,” CVPR, 2017. arXiv
- A. G. Howard, M. Zhu, B. Chen, D. Kalenichenko, W. Wang, T. Weyand, M. Andreetto, and H. Adam, “MobileNets: Efficient Convolutional Neural Networks for Mobile Vision Applications,” arXiv:1704.04861, 2017. arXiv
- M. Tan and Q. V. Le, “EfficientNet: Rethinking Model Scaling for Convolutional Neural Networks,” ICML, 2019. arXiv
- I. Radosavovic, R. P. Kosaraju, R. Girshick, K. He, and P. Dollár, “Designing Network Design Spaces,” CVPR, 2020. arXiv
- Z. Liu, H. Mao, C.-Y. Wu, C. Feichtenhofer, T. Darrell, and S. Xie, “A ConvNet for the 2020s,” CVPR, 2022. arXiv
- J. Hu, L. Shen, S. Albanie, G. Sun, and E. Wu, “Squeeze-and-Excitation Networks,” arXiv:1709.01507, 2017 (journal version in IEEE TPAMI). arXiv
- A. Dosovitskiy, L. Beyer, A. Kolesnikov, D. Weissenborn, X. Zhai, T. Unterthiner, et al., “An Image is Worth 16x16 Words: Transformers for Image Recognition at Scale,” ICLR, 2021. arXiv
- H. Touvron, M. Cord, M. Douze, F. Massa, A. Sablayrolles, and H. Jégou, “Training Data-Efficient Image Transformers & Distillation through Attention,” ICML, PMLR vol. 139, 2021. paper
- Z. Liu, Y. Lin, Y. Cao, H. Hu, Y. Wei, Z. Zhang, S. Lin, and B. Guo, “Swin Transformer: Hierarchical Vision Transformer using Shifted Windows,” ICCV, 2021. doi:10.1109/ICCV48922.2021.00986
- S. Khan, M. Naseer, M. Hayat, S. W. Zamir, F. S. Khan, and M. Shah, “Transformers in Vision: A Survey,” ACM Computing Surveys, 2022. arXiv
- H. Zhang, M. Cisse, Y. N. Dauphin, and D. Lopez-Paz, “mixup: Beyond Empirical Risk Minimization,” ICLR, 2018. arXiv
- S. Yun, D. Han, S. J. Oh, S. Chun, J. Choe, and Y. Yoo, “CutMix: Regularization Strategy to Train Strong Classifiers with Localizable Features,” ICCV, 2019. arXiv
- E. D. Cubuk, B. Zoph, J. Shlens, and Q. V. Le, “RandAugment: Practical Automated Data Augmentation with a Reduced Search Space,” CVPR Workshops, 2020. doi:10.1109/CVPRW50498.2020.00359
- I. Loshchilov and F. Hutter, “Decoupled Weight Decay Regularization,” ICLR, 2019. arXiv
- I. Loshchilov and F. Hutter, “SGDR: Stochastic Gradient Descent with Warm Restarts,” ICLR, 2017. arXiv
- G. Huang, Y. Sun, Z. Liu, D. Sedra, and K. Q. Weinberger, “Deep Networks with Stochastic Depth,” ECCV, 2016. doi:10.1007/978-3-319-46493-0_39
- R. Wightman, H. Touvron, and H. Jégou, “ResNet Strikes Back: An Improved Training Procedure in timm,” arXiv:2110.00476, 2021. arXiv
- S. Kornblith, J. Shlens, and Q. V. Le, “Do Better ImageNet Models Transfer Better?,” CVPR, 2019. arXiv
- T. Chen, S. Kornblith, M. Norouzi, and G. Hinton, “A Simple Framework for Contrastive Learning of Visual Representations,” ICML, 2020. arXiv
- K. He, H. Fan, Y. Wu, S. Xie, and R. Girshick, “Momentum Contrast for Unsupervised Visual Representation Learning,” CVPR, 2020. arXiv
- M. Caron, H. Touvron, I. Misra, H. Jégou, J. Mairal, P. Bojanowski, and A. Joulin, “Emerging Properties in Self-Supervised Vision Transformers,” ICCV, 2021. doi:10.1109/ICCV48922.2021.00951
- K. He, X. Chen, S. Xie, Y. Li, P. Dollár, and R. Girshick, “Masked Autoencoders Are Scalable Vision Learners,” CVPR, 2022. doi:10.1109/CVPR52688.2022.01553
- M. Oquab, T. Darcet, T. Moutakanni, H. Vo, M. Szafraniec, V. Khalidov, et al., “DINOv2: Learning Robust Visual Features without Supervision,” Transactions on Machine Learning Research, 2024. arXiv
- O. Siméoni, H. V. Vo, M. Seitzer, F. Baldassarre, M. Oquab, C. Jose, et al., “DINOv3,” arXiv:2508.10104, 2025. arXiv
- A. Radford, J. W. Kim, C. Hallacy, A. Ramesh, G. Goh, S. Agarwal, et al., “Learning Transferable Visual Models From Natural Language Supervision,” ICML, PMLR vol. 139, 2021. paper
- J. Gui, T. Chen, J. Zhang, Q. Cao, Z. Sun, H. Luo, and D. Tao, “A Survey on Self-Supervised Learning: Algorithms, Applications, and Future Trends,” IEEE Transactions on Pattern Analysis and Machine Intelligence (arXiv:2301.05712, 2023). arXiv
- D. Hendrycks and T. Dietterich, “Benchmarking Neural Network Robustness to Common Corruptions and Perturbations,” ICLR, 2019. arXiv
- D. Hendrycks, S. Basart, N. Mu, S. Kadavath, F. Wang, E. Dorundo, et al., “The Many Faces of Robustness: A Critical Analysis of Out-of-Distribution Generalization,” ICCV, 2021. arXiv
- D. Hendrycks, K. Zhao, S. Basart, J. Steinhardt, and D. Song, “Natural Adversarial Examples,” CVPR, 2021. arXiv
- I. J. Goodfellow, J. Shlens, and C. Szegedy, “Explaining and Harnessing Adversarial Examples,” in Proc. International Conference on Learning Representations (ICLR), 2015. arXiv
- R. Geirhos, J.-H. Jacobsen, C. Michaelis, R. Zemel, W. Brendel, M. Bethge, and F. A. Wichmann, “Shortcut Learning in Deep Neural Networks,” Nature Machine Intelligence, 2020. arXiv
- C. Guo, G. Pleiss, Y. Sun, and K. Q. Weinberger, “On Calibration of Modern Neural Networks,” ICML, 2017. arXiv
- B. Zhou, A. Khosla, A. Lapedriza, A. Oliva, and A. Torralba, “Learning Deep Features for Discriminative Localization,” CVPR, 2016. doi:10.1109/CVPR.2016.319
- R. R. Selvaraju, M. Cogswell, A. Das, R. Vedantam, D. Parikh, and D. Batra, “Grad-CAM: Visual Explanations from Deep Networks via Gradient-Based Localization,” ICCV, 2017. doi:10.1109/ICCV.2017.74
- B. Jacob, S. Kligys, B. Chen, M. Zhu, M. Tang, A. Howard, et al., “Quantization and Training of Neural Networks for Efficient Integer-Arithmetic-Only Inference,” CVPR, 2018. doi:10.1109/CVPR.2018.00286
- G. Hinton, O. Vinyals, and J. Dean, “Distilling the Knowledge in a Neural Network,” arXiv:1503.02531, 2015. arXiv
- X. Zhai, A. Kolesnikov, N. Houlsby, and L. Beyer, “Scaling Vision Transformers,” CVPR, 2022. arXiv
- M. Cherti, R. Beaumont, R. Wightman, M. Wortsman, G. Ilharco, C. Gordon, et al., “Reproducible Scaling Laws for Contrastive Language-Image Learning,” CVPR, 2023. arXiv
- T. Fawcett, “An Introduction to ROC Analysis,” Pattern Recognition Letters, vol. 27, no. 8, pp. 861–874, 2006. doi:10.1016/j.patrec.2005.10.010
- J. Davis and M. Goadrich, “The Relationship Between Precision-Recall and ROC Curves,” Proc. 23rd International Conference on Machine Learning (ICML), pp. 233–240, 2006. doi:10.1145/1143844.1143874
- T. Saito and M. Rehmsmeier, “The Precision-Recall Plot Is More Informative than the ROC Plot When Evaluating Binary Classifiers on Imbalanced Datasets,” PLOS ONE, vol. 10, no. 3, e0118432, 2015. doi:10.1371/journal.pone.0118432
- D. Chicco and G. Jurman, “The Advantages of the Matthews Correlation Coefficient (MCC) over F1 Score and Accuracy in Binary Classification Evaluation,” BMC Genomics, vol. 21, article 6, 2020. doi:10.1186/s12864-019-6413-7
- M. Sokolova and G. Lapalme, “A Systematic Analysis of Performance Measures for Classification Tasks,” Information Processing & Management, vol. 45, no. 4, pp. 427–437, 2009. doi:10.1016/j.ipm.2009.03.002
- J. Cohen, “A Coefficient of Agreement for Nominal Scales,” Educational and Psychological Measurement, vol. 20, no. 1, pp. 37–46, 1960. doi:10.1177/001316446002000104
- M.-L. Zhang and Z.-H. Zhou, “A Review on Multi-Label Learning Algorithms,” IEEE Transactions on Knowledge and Data Engineering, vol. 26, no. 8, pp. 1819–1837, 2014. doi:10.1109/TKDE.2013.39
- M. Everingham, L. Van Gool, C. K. I. Williams, J. Winn, and A. Zisserman, “The Pascal Visual Object Classes (VOC) Challenge,” International Journal of Computer Vision, vol. 88, no. 2, pp. 303–338, 2010. doi:10.1007/s11263-009-0275-4
- F. Pedregosa, G. Varoquaux, A. Gramfort, V. Michel, B. Thirion, O. Grisel, et al., “Scikit-learn: Machine Learning in Python,” Journal of Machine Learning Research, vol. 12, pp. 2825–2830, 2011. paper
- H. Wang, S. Ge, E. P. Xing, and Z. C. Lipton, “Learning Robust Global Representations by Penalizing Local Predictive Power,” NeurIPS, 2019 (introduces ImageNet-Sketch). arXiv
- A. Barbu, D. Mayo, J. Alverio, W. Luo, C. Wang, D. Gutfreund, J. Tenenbaum, and B. Katz, “ObjectNet: A Large-Scale Bias-Controlled Dataset for Pushing the Limits of Object Recognition Models,” NeurIPS, 2019. dataset page
- C. Wah, S. Branson, P. Welinder, P. Perona, and S. Belongie, “The Caltech-UCSD Birds-200-2011 Dataset,” Technical Report CNS-TR-2011-001, California Institute of Technology, 2011. dataset page
- J. Krause, M. Stark, J. Deng, and L. Fei-Fei, “3D Object Representations for Fine-Grained Categorization,” IEEE International Conference on Computer Vision Workshops (ICCVW), pp. 554–561, 2013 (introduces Stanford Cars). doi:10.1109/ICCVW.2013.77
- S. Maji, E. Rahtu, J. Kannala, M. Blaschko, and A. Vedaldi, “Fine-Grained Visual Classification of Aircraft,” arXiv:1306.5151, 2013. arXiv
- O. M. Parkhi, A. Vedaldi, A. Zisserman, and C. V. Jawahar, “Cats and Dogs,” CVPR, 2012 (introduces Oxford-IIIT Pets). dataset page
- M.-E. Nilsback and A. Zisserman, “Automated Flower Classification over a Large Number of Classes,” Indian Conference on Computer Vision, Graphics and Image Processing (ICVGIP), 2008 (introduces Oxford Flowers-102). dataset page
- L. Bossard, M. Guillaumin, and L. Van Gool, “Food-101 – Mining Discriminative Components with Random Forests,” ECCV, 2014. dataset page
- L. Fei-Fei, R. Fergus, and P. Perona, “One-Shot Learning of Object Categories,” IEEE Transactions on Pattern Analysis and Machine Intelligence, 2006 (the reference given for Caltech-101). dataset page
- X. Zhai, J. Puigcerver, A. Kolesnikov, et al., “A Large-scale Study of Representation Learning with the Visual Task Adaptation Benchmark,” arXiv:1910.04867, 2019. arXiv
- Z. Liu, Z. Miao, X. Zhan, J. Wang, B. Gong, and S. X. Yu, “Large-Scale Long-Tailed Recognition in an Open World,” CVPR, 2019 (introduces ImageNet-LT). arXiv
Check your understanding
This tutorial has 7 exercises. Can you solve them without opening the hints?
Go to the exercises ↑Next DLCV 02A · Face Recognition and Metric Learning · 40 min