IP 12 · Feature Extraction
Needs: IP 11 · Image Segmentation II: Active Contours — Snakes and Level Sets
Navigate: this page and this track: Navigate: this page and this track
On this page
- What you’ll learn1 min
- The big picture1 min
- Background: features, descriptors and invariance1 min
- Boundary preprocessing4 min
- Boundary feature descriptors3 min
- Region feature descriptors4 min
- Principal components as feature descriptors2 min
- Whole-image features3 min
- Scale-invariant feature transform (SIFT)4 min
- Modern view2 min
- Key takeaways1 min
- Exercises3 min
- Supplementary notes
- Paper guides
- References
- The Moore boundary-following procedure
- Slope chain codes
- Minimum-perimeter polygons in more detail
- The medial axis transform
- Computing shape numbers of a given order
- Moments of a 1-D boundary function
- Euler’s formula for polygonal networks
- Keypoint localization
- RANSAC: fitting a model despite outliers
- Learned features in more detail
Image Processing
Explore this chapter 1 interactive experiment
Slide a small window over a real photograph and watch the window’s gradient vectors, its structure-tensor ellipse and the Harris response decide whether the spot is flat, an edge or a corner.
What you’ll learn
- The difference between a feature and a descriptor, and the four invariances most descriptors try to have: translation, rotation, scale and illumination.
- How to turn a segmented boundary into something measurable: chain codes, polygons, signatures and skeletons, and then into numbers such as shape numbers and Fourier descriptors.
- How to describe whole regions by size, shape, topology (Euler number), texture (histogram moments, co-occurrence matrices, spectra) and moment invariants.
- How principal component analysis (PCA) aligns objects and compresses many measurements into a few.
- How the Harris–Stephens corner detector, maximally stable extremal regions (MSER) and SIFT find and describe interest points that can be matched across two photos.
- How surveys of the last two decades judge these handcrafted features, and where learned features (SuperPoint, LoFTR, LightGlue, DINOv2) have replaced them.
The big picture
Segmentation (IP 10 and IP 11) told us where objects are. A program still cannot “look at” a region the way we do. It needs a short list of numbers that says what the region is like, so that it can compare, sort, search and recognize. Producing that list is feature extraction.
This chapter follows the order of Gonzalez and Woods [1]. We start with boundaries, move to regions, then to statistics over many measurements (PCA), and end with features that need no segmentation at all: corners, stable regions and SIFT keypoints. These last ones connect classical image processing to modern computer vision tasks such as panorama stitching, 3D reconstruction and visual localization.
Background: features, descriptors and invariance
Plain version. A feature is something interesting you found in an image (a corner, a blob, a region). A descriptor is the list of numbers you use to describe it. We want descriptors that do not change when things that do not matter change.
Precise version. Following [1], we separate two steps:
- Feature detection finds where a feature is: a boundary, a region, a point with its scale and orientation.
- Feature description assigns a vector to each detected feature.
A descriptor is invariant to a family of transformations if
where is the image (or region) and a transformation applied to it. It is covariant if the detected quantity changes with the transformation in a predictable way (for example, a keypoint’s position moves with the object, and its detected scale doubles when the object doubles). Detectors should be covariant; descriptors should be invariant.
The transformations we care about most are:
| Change | What it does to the image | Typical cure |
|---|---|---|
| Translation | shifts coordinates | subtract a centroid, or use differences |
| Rotation | rotates coordinates | use a canonical orientation, magnitudes, or rotation-free quantities |
| Scale | multiplies coordinates | normalize by size, or search over scale |
| Illumination | changes intensities, roughly | use gradients (remove ) and normalize (remove ) |
There is always a trade-off between invariance and discriminative power. A descriptor invariant to everything describes nothing: a “6” rotated by 180° is a “9”. Choosing features is choosing which differences matter for your task.
Boundary preprocessing
Plain version. Before we can measure a boundary, we must list its pixels in order and, often, simplify it so that noise and pixel staircases do not dominate.
Boundary following
A segmented region is a set of pixels, but most boundary descriptors need the boundary as an ordered, closed sequence of points . A boundary-following algorithm produces that list by walking around the region, pixel by pixel, from a fixed starting pixel until it returns to the start [1]. OpenCV’s cv2.findContours and scikit-image’s measure.find_contours give you this list directly.
Optional: The Moore boundary-following procedure (in the Supplementary notes). The step-by-step rule for walking around a region through its 8-neighbourhoods.
Chain codes
A chain code replaces the list of points with a list of directions. Each step from one boundary pixel to the next is one of 4 or 8 directions, coded 0–3 or 0–7 counterclockwise from east [1]. The code is compact (3 bits per step for 8 directions) and already independent of translation.
Two problems remain. The code depends on the start point, and it depends on rotation. The fixes are simple:
- Start point. Treat the code as circular and choose the rotation of the sequence that forms the smallest integer.
- Rotation (by multiples of 45°). Use the first difference: the number of direction changes, counted counterclockwise, between consecutive elements, , where is the -th code element. Turning the object by 90° adds 2 to every and leaves every unchanged.
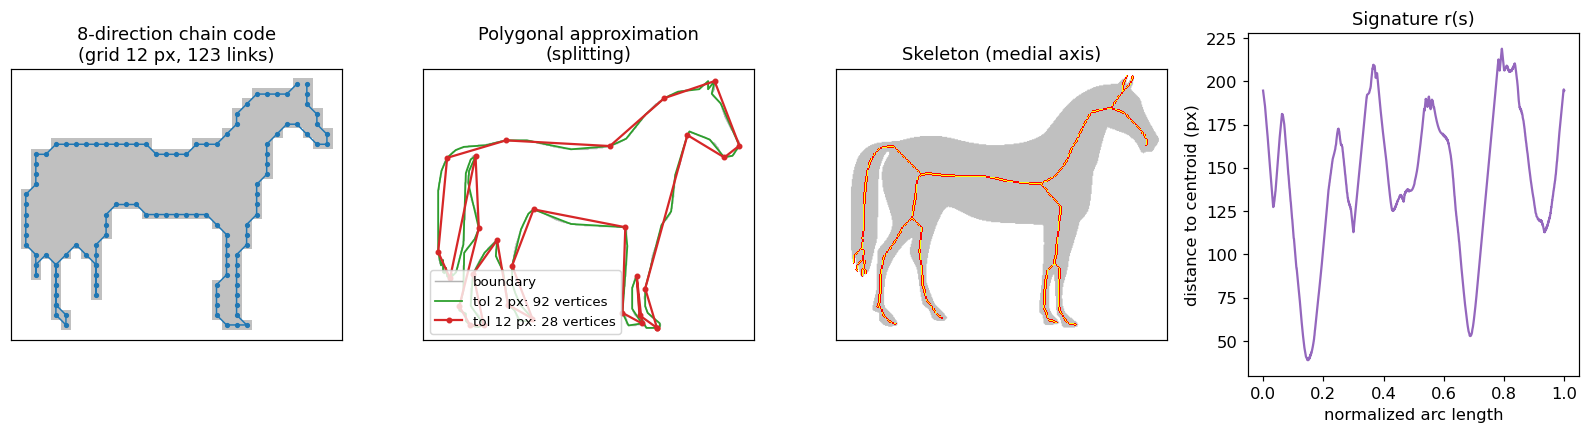
Raw chain codes on the full pixel grid are long and noisy. In practice the boundary is first resampled on a coarser grid, so that each link spans several pixels (Figure 12.1, left).
Code · Python · 17 lines
import numpy as np, cv2
from skimage import data

mask = (data.horse() == 0).astype(np.uint8)          # True inside the horse
cnts, _ = cv2.findContours(mask, cv2.RETR_EXTERNAL, cv2.CHAIN_APPROX_NONE)
pts = max(cnts, key=len)[:, 0, :]                    # (x, y), 8-connected boundary

# Freeman 8-direction code: 0 = east, counted counter-clockwise (y points down)
DIRS = {(1, 0): 0, (1, -1): 1, (0, -1): 2, (-1, -1): 3,
        (-1, 0): 4, (-1, 1): 5, (0, 1): 6, (1, 1): 7}
steps = np.diff(np.vstack([pts, pts[:1]]), axis=0)
code = np.array([DIRS[tuple(s)] for s in steps])

diff = (code - np.roll(code, 1)) % 8                 # first difference: rotation invariant
shifts = [tuple(np.roll(diff, -i)) for i in range(len(diff))]
shape_number = min(shifts)                           # start-point invariant
print(len(code), code[:12], diff[:12])
Optional: Slope chain codes (in the Supplementary notes). A chain code that records real-valued slope changes instead of eight directions.
Polygonal approximation
A polygon can capture the essence of a boundary with a few vertices.
Minimum-perimeter polygons (MPP). Picture a rubber band that shrinks inside a thin strip of cells covering the boundary; the shortest closed path it settles into is the MPP [1]. The cell size controls the detail: big cells give a coarse polygon.
Optional: Minimum-perimeter polygons in more detail (in the Supplementary notes). The strip of cells, where the vertices must lie, and why that gives an efficient algorithm.
Merging. Walk along the boundary and keep adding points to the current segment while the least-squares line-fit error stays below a threshold . When the error exceeds , start a new segment. This is simple, but vertices may not land at true corners.
Splitting. Join the two most distant boundary points with a chord. Find the boundary point farthest from that chord; if its distance exceeds , make it a vertex and split the problem in two. Repeat recursively. Splitting tends to place vertices at real inflection points. skimage.measure.approximate_polygon implements this recursive splitting idea; Figure 12.1 (second panel) shows two tolerances.
Signatures
A signature reduces a 2-D boundary to a 1-D function. The simplest is the distance from the centroid to the boundary as a function of angle, , or of normalized arc length, [1]. A circle gives a constant; a square gives four identical bumps. Signatures are translation invariant by construction. Rotation becomes a circular shift of the function, and scale becomes a multiplication, so we normalize by choosing a canonical start (for example the farthest point) and dividing by the maximum or by the standard deviation. is a function only for star-shaped regions; for shapes like the horse in Figure 12.1, a ray from the centroid can cross the boundary more than once, which is why is used there.
Skeletons and the medial axis
Plain version. Light a fire on the entire edge of a grass field at the same moment. The places where fire fronts from different sides meet form the skeleton.
Precise version. The medial axis of a region is the set of points that have more than one closest point on the region’s border [1]. In practice skeletons are computed by thinning (see IP 09), and because they are very sensitive to small bumps on the boundary, smoothing or pruning short branches is usually needed.
Optional: The medial axis transform (in the Supplementary notes). How the medial-axis points and their distances rebuild the region exactly, and how thinning computes a skeleton.
Boundary feature descriptors
Plain version. Once a boundary is an ordered list, we can measure it: how long it is, how wide, how bent, and how it looks when written as a sum of waves.
Basic descriptors
- Length. The number of pixels on the boundary is a rough estimate. With an 8-connected chain code, count horizontal and vertical steps as 1 and diagonal steps as .
- Diameter. , where are boundary points and is a distance (usually Euclidean). The segment joining the two maximizing points is the major axis; the minor axis is perpendicular to it, with length chosen so that a box with these two sides encloses the boundary. That box is the basic rectangle.
- Eccentricity. The ratio of major-axis length to minor-axis length. (Region-based eccentricity, below, uses second moments instead.)
- Curvature. The rate of change of slope along the boundary. On a digital boundary it is noisy, so we usually compute the slope difference between line segments fitted on either side of a point. Where curvature changes sign, the boundary has an inflection; positive curvature (in the walking direction) marks a convex part, negative a concave part.
Shape numbers
The shape number of a boundary is the first difference of its 4-direction chain code, circularly shifted to form the smallest integer [1]. Its length is the order of the shape. Before two shapes are compared, the grid is aligned with each shape’s orientation; they are then compared by their degree of similarity, the largest order for which their shape numbers still agree.
Optional: Computing shape numbers of a given order (in the Supplementary notes). How to fix the orientation and the grid size so that two shape numbers can be compared fairly.
Fourier descriptors
Plain version. Walk around the boundary and write each point as a complex number. The sequence repeats every lap, so we can decompose it into waves. The first few, slow waves give the rough outline; fast waves add the details.
Precise version. Let the boundary be points , , and write each as
The discrete Fourier transform of gives the Fourier descriptors
and the inverse rebuilds the boundary. If we keep only of the coefficients (the lowest frequencies, both positive and negative) and set the rest to zero, we get an approximation that is smooth and keeps the overall shape (Figure 12.2). This is why a handful of Fourier descriptors can represent a shape compactly.
The descriptors react to basic geometric changes in simple ways [1]:
| Change to the boundary | Effect on |
|---|---|
| Translation by | only changes: |
| Rotation by | every coefficient is multiplied by |
| Scaling by | every coefficient is multiplied by |
| Start point moved by | is multiplied by |
So we can build an invariant descriptor: drop (translation), divide by (scale), and keep only magnitudes (rotation and start point). The cost of keeping only magnitudes is losing phase, which carries part of the shape information. This normalization requires a nonzero first harmonic; a symmetric contour or a change of traversal direction can make it vanish. The code rejects a numerically tiny first harmonic rather than dividing by it. Comparing independently traced shapes also requires a common sampling convention and traversal direction; the transformation experiment below keeps the same samples.
Code · Python · 19 lines
import numpy as np
from skimage import data, measure

mask = data.horse() == 0
c = max(measure.find_contours(mask.astype(float), 0.5), key=len)
z = c[:, 1] + 1j * c[:, 0]                       # boundary as complex numbers x + jy

def fourier_descriptor(z, n=16):
    a = np.fft.fft(z)
    a[0] = 0                                     # drop DC   -> translation invariance
    scale = np.abs(a[1])
    if scale <= 1e-12 * np.linalg.norm(a):
        raise ValueError("first harmonic is too small for this normalization")
    a = a / scale                                # divide by |a(1)| -> scale invariance
    return np.abs(np.r_[a[1:n + 1], a[-n:]])     # magnitudes -> rotation and start-point invariance

f1 = fourier_descriptor(z)
f2 = fourier_descriptor(0.5 * np.exp(1j * 0.7) * np.roll(z, 300) + (40 + 10j))
print(np.abs(f1 - f2).max())                     # ~1e-16: same descriptor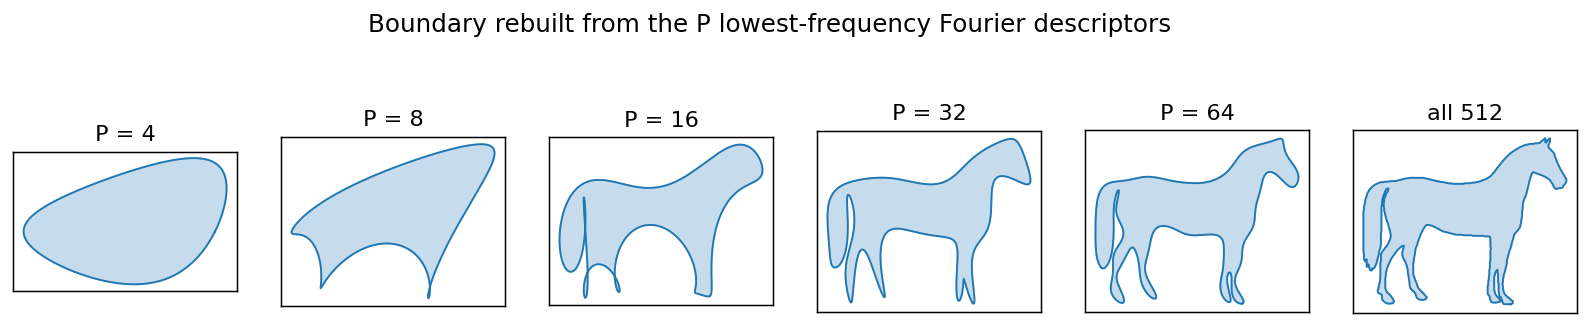
Statistical moments of a boundary
In plain words: treat a boundary segment or a signature as a 1-D curve and summarize it with a few statistical moments, such as its spread and its asymmetry [1]. Moments are cheap, physically interpretable, and insensitive to rotation if computed on a rotation-normalized signature.
Optional: Moments of a 1-D boundary function (in the Supplementary notes). The formulas, and the two ways of turning a curve into a distribution.
Region feature descriptors
Plain version. Instead of tracing the edge, we can look at the whole patch: how big it is, how round, how many holes it has, and how its inside looks (smooth, grainy, striped).
Basic descriptors
- Area : the number of pixels in the region.
- Perimeter : the length of its boundary.
- Compactness: . It is dimensionless, so it is invariant to scale (and to translation and rotation, up to digitization error). A disk minimizes it.
- Circularity: . It equals 1 for a disk and decreases for elongated or ragged regions. It is the inverse of compactness, rescaled.
- Effective diameter: , the diameter of a disk with the same area.
- Eccentricity (from moments): with the eigenvalues of the covariance matrix of the pixel coordinates, . It is 0 for a disk and approaches 1 for a line segment. (This is the definition used by scikit-image.)
Code · Python · 12 lines
import numpy as np
from skimage import data, filters, measure, morphology, segmentation

img = data.coins()
bw = img > filters.threshold_otsu(img)
bw = morphology.binary_closing(bw, morphology.disk(2))
bw = segmentation.clear_border(morphology.remove_small_objects(bw, 200))
for r in measure.regionprops(measure.label(bw))[:4]:
    circ = 4 * np.pi * r.area / r.perimeter ** 2  # 1 for a perfect disk
    print(f"area={r.area:5.0f}  circularity={circ:.2f}  "
          f"eccentricity={r.eccentricity:.2f}  euler={r.euler_number}  "
          f"hu1={r.moments_hu[0]:.4f}")
On the coins image, the well-segmented coins have circularity around 0.9 and eccentricity around 0.3–0.4 (digital perimeters are slightly overestimated, so even a perfect digital disk scores a bit below 1).
Topological descriptors
Topology studies properties that survive rubber-sheet deformations: stretching and bending without tearing or gluing. Area and perimeter are not topological; the number of pieces and the number of holes are. The Euler number is
where is the number of connected components and the number of holes [1]. The letter “A” has (one component, one hole); “B” has . Note that depends on the connectivity convention (4 or 8) used for foreground and background.
Optional: Euler’s formula for polygonal networks (in the Supplementary notes). How the numbers of vertices, edges and faces give the same Euler number.
Texture
Plain version. Texture is how a surface “feels” to the eye: smooth, coarse, regular. We describe it with statistics of the pixel values and of how pixel values sit next to each other.
Statistical moments of the histogram. Let be a random variable for intensity, the normalized histogram, , and the mean. Then [1]:
is 0 for a constant region and approaches 1 for high variance (normalize to first, for example by dividing by ). measures histogram skew. These measures ignore where pixels are, so a checkerboard and its shuffled version get identical values.
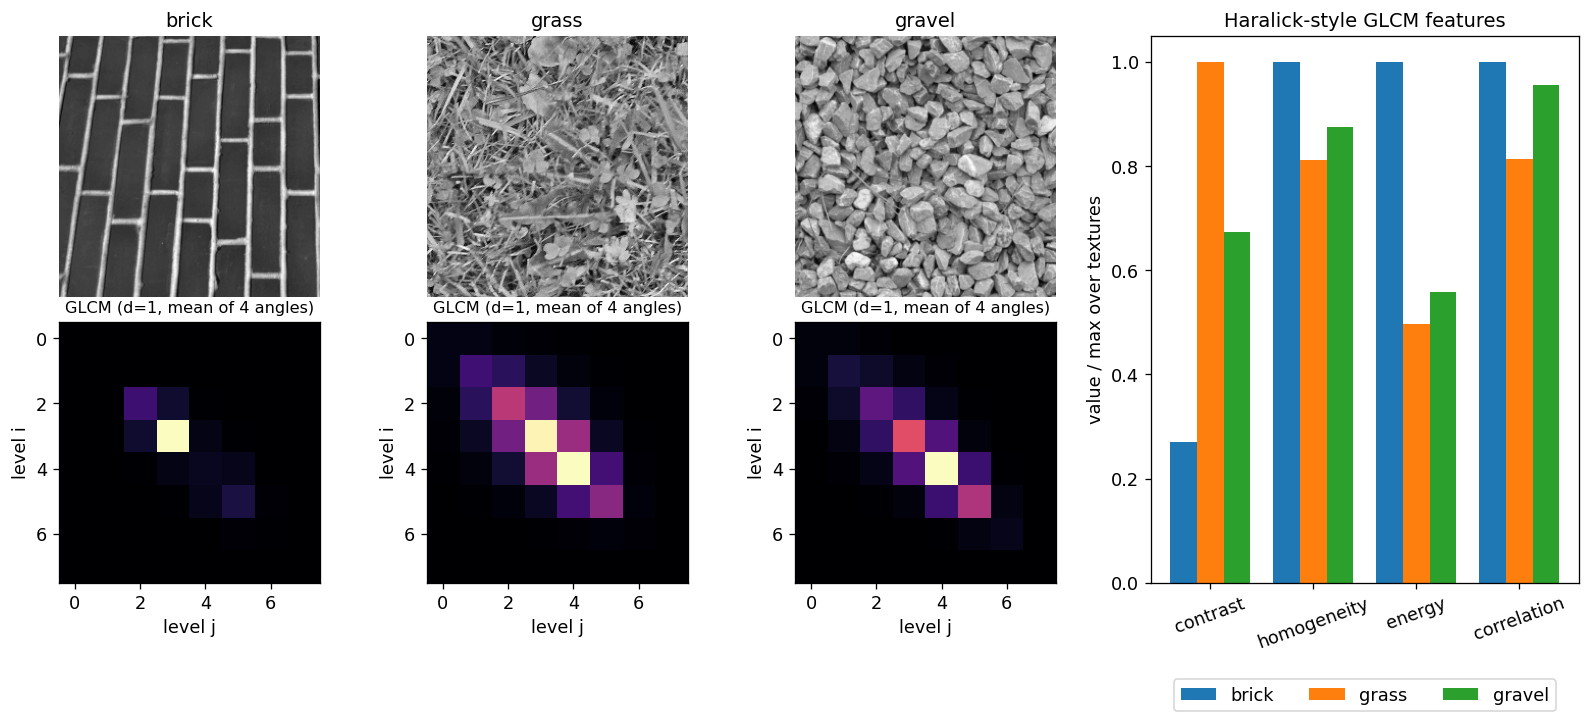
Co-occurrence matrices. To capture spatial arrangement, Haralick, Shanmugam and Dinstein proposed the gray-level co-occurrence matrix (GLCM) [3]. Fix a position operator , for example “one pixel to the right”. Then is an matrix whose element counts how many times a pixel with level has a pixel with level in position . Let and
the estimated probability of that pair. Useful descriptors computed from include (with and the means and standard deviations of the row and column marginals):
(scikit-image’s graycoprops reports “energy” as the square root of the uniformity sum.) Mass near the diagonal means neighbors have similar values (smooth texture, high homogeneity, low contrast). Mass spread away from the diagonal means rapid changes (high contrast). In practice we quantize to few levels (8–32), compute for several angles and distances, and average over angles for approximate rotation invariance.
Code · Python · 10 lines
import numpy as np
from skimage import data
from skimage.feature import graycomatrix, graycoprops

for name in ["brick", "grass", "gravel"]:
    q = (getattr(data, name)()[:256, :256] // 32).astype(np.uint8)   # 8 gray levels
    P = graycomatrix(q, distances=[1], angles=[0, np.pi/4, np.pi/2, 3*np.pi/4],
                     levels=8, symmetric=True, normed=True)
    feats = {p: graycoprops(P, p).mean() for p in ["contrast", "homogeneity", "energy", "correlation"]}
    print(name, {k: round(float(v), 3) for k, v in feats.items()})
Output
brick  {'contrast': 0.269, 'homogeneity': 0.883, 'energy': 0.579, 'correlation': 0.817}
grass  {'contrast': 0.995, 'homogeneity': 0.717, 'energy': 0.288, 'correlation': 0.664}
gravel {'contrast': 0.669, 'homogeneity': 0.772, 'energy': 0.323, 'correlation': 0.78}
The brick wall is dominated by large flat bricks, so its GLCM is concentrated on a few diagonal cells: high energy, low contrast. Grass changes from blade to blade, so its GLCM spreads out: highest contrast, lowest energy. Four numbers already separate the three textures (Figure 12.3).
Spectral texture. Periodic or directional texture produces strong, concentrated peaks in the Fourier spectrum. Write the spectrum in polar coordinates, , where is the distance from the origin (frequency) and the direction. Two 1-D functions summarize it [1]:
where is the spectrum along the ray at angle , the spectrum on the half-circle of radius , and the largest radius considered. Peaks in reveal the period of the pattern (the brick spacing); peaks in reveal its dominant directions. Only half the circle is needed because the spectrum of a real image is symmetric about the origin.
Moment invariants
In plain words: moments summarize how a region’s mass is spread around its centre; suitable combinations of them do not change when the region is moved, scaled or rotated.
For a 2-D image (or region indicator) of size , the moment of order is
and the central moment is
where is the centroid. Central moments are translation invariant. Normalized central moments
are also scale invariant. Hu [2] derived seven combinations of the second- and third-order that are invariant to translation, scale and rotation. The first two are
is the normalized “moment of inertia” about the centroid: it grows as mass moves away from the center. measures elongation. The seventh invariant changes sign under reflection, so it can tell a shape from its mirror image. Because higher-order moments amplify noise, and their values span many orders of magnitude, people usually compare . In scikit-image, regionprops(...).moments_hu returns all seven; in OpenCV, cv2.HuMoments(cv2.moments(mask)).
Principal components as feature descriptors
Plain version. When we measure many things about an object, some measurements tell the same story twice. PCA finds a new set of axes ordered from “most informative” to “least informative”, so we can keep the first few and drop the rest. For a 2-D shape, the first axis is simply the direction in which the shape is longest.
Precise version. Let be -dimensional vectors: for example the band values of each pixel in a multispectral image, or the coordinates of each pixel of a region. Their mean and covariance are
is real and symmetric, so it has orthonormal eigenvectors with eigenvalues . Stack the eigenvectors as rows of a matrix . The Hotelling transform (also called the discrete Karhunen–Loève transform, or PCA) is
The new vectors have zero mean and a diagonal covariance, : the components of are uncorrelated, and the variance along the -th axis is . If we keep only the first rows, , the reconstruction has mean squared error
the sum of the discarded eigenvalues. No other linear projection onto dimensions does better in this sense.
Three uses in image processing [1]:
- Compressing multispectral images. With registered bands, each pixel is an -vector. Most of the variance usually sits in the first two or three principal-component images, so they can replace all bands for display or classification.
- Normalizing object pose. Use the pixel coordinates of a region as the vectors. Then moves the centroid to the origin and rotates the region so that its major axis lies along the first coordinate axis (Figure 12.4). Descriptors computed afterwards are translation and rotation invariant; dividing by adds scale invariance. One caveat: an eigenvector’s sign is arbitrary, so the aligned object may be flipped; a rule such as “the heavier third-moment side points right” resolves it.
- Eigen-images. Flatten each of many same-size images of one object class into a vector. The leading eigenvectors, reshaped back to images, are “eigen-images” that span most of the variation in the set. Any new image can then be described by its handful of coordinates , a compact feature vector for recognition.
Code · Python · 11 lines
import numpy as np
from skimage import data, transform

mask = transform.rotate((data.horse() == 0).astype(float), 35, resize=True) > 0.5
X = np.argwhere(mask)[:, ::-1].astype(float)     # (x, y) of every object pixel
m = X.mean(axis=0)
C = np.cov((X - m).T)                            # 2x2 covariance matrix
evals, evecs = np.linalg.eigh(C)                 # ascending eigenvalues
A = evecs[:, ::-1].T                             # rows = eigenvectors, largest first
Y = (X - m) @ A.T                                # Hotelling transform y = A(x - m)
print(np.round(np.cov(Y.T), 3))                  # diagonal: the axes are decorrelated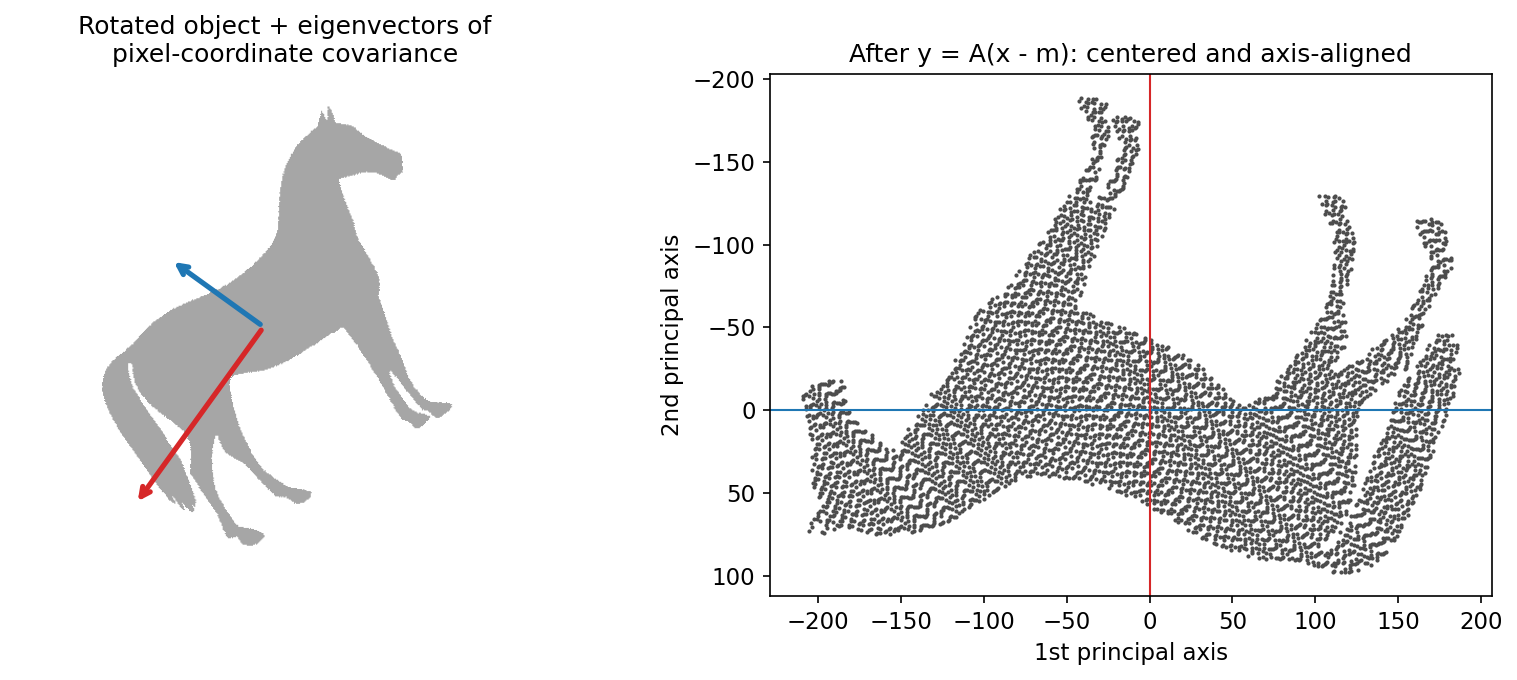
Whole-image features
Plain version. So far we needed a segmented object. Many tasks (stitching panoramas, tracking, 3D reconstruction) instead need landmarks that can be found automatically in any photo and found again in another photo of the same scene. Corners and stable blobs are good landmarks.
The Harris–Stephens corner detector
Plain version. Look at the image through a tiny window and slide it a little. In a flat area nothing changes. Along an edge, sliding along the edge changes nothing but sliding across does. At a corner, sliding in any direction changes the view. Harris and Stephens turned this into a formula [4].
Precise version. The change in a window caused by a shift is
using a first-order Taylor expansion, with the structure tensor (second-moment matrix)
where are the image derivatives and is a window, usually Gaussian. The eigenvalues of tell the story: both small means flat, one large means edge, both large means corner. Computing eigenvalues at every pixel was costly in 1988, so Harris and Stephens used the response
with a small constant (values around 0.04–0.06 are common). is large and positive at corners, negative at edges, and near zero in flat areas. Corners are local maxima of above a threshold, after non-maximum suppression.
Properties: is built from derivatives, so ignores additive brightness changes; its eigenvalues do not depend on rotation, so the detector is rotation covariant. It is not scale covariant: a corner seen through a small window may look like an edge through a large one. Scale is what SIFT adds.
Code · Python · 16 lines
import numpy as np
from scipy import ndimage as ndi
from skimage import data, feature, util

def harris(img, sigma_d=1.0, sigma_i=1.5, k=0.05):
    Ix = ndi.gaussian_filter(img, sigma_d, order=(0, 1))   # derivative along x (columns)
    Iy = ndi.gaussian_filter(img, sigma_d, order=(1, 0))   # derivative along y (rows)
    Sxx = ndi.gaussian_filter(Ix * Ix, sigma_i)            # entries of the structure tensor M
    Syy = ndi.gaussian_filter(Iy * Iy, sigma_i)
    Sxy = ndi.gaussian_filter(Ix * Iy, sigma_i)
    det, tr = Sxx * Syy - Sxy ** 2, Sxx + Syy
    return det - k * tr ** 2                               # R > 0 corner, R < 0 edge, |R| small flat

img = util.img_as_float(data.camera())
R = harris(img)
corners = feature.corner_peaks(R, min_distance=7, threshold_rel=0.02)   # (row, col) list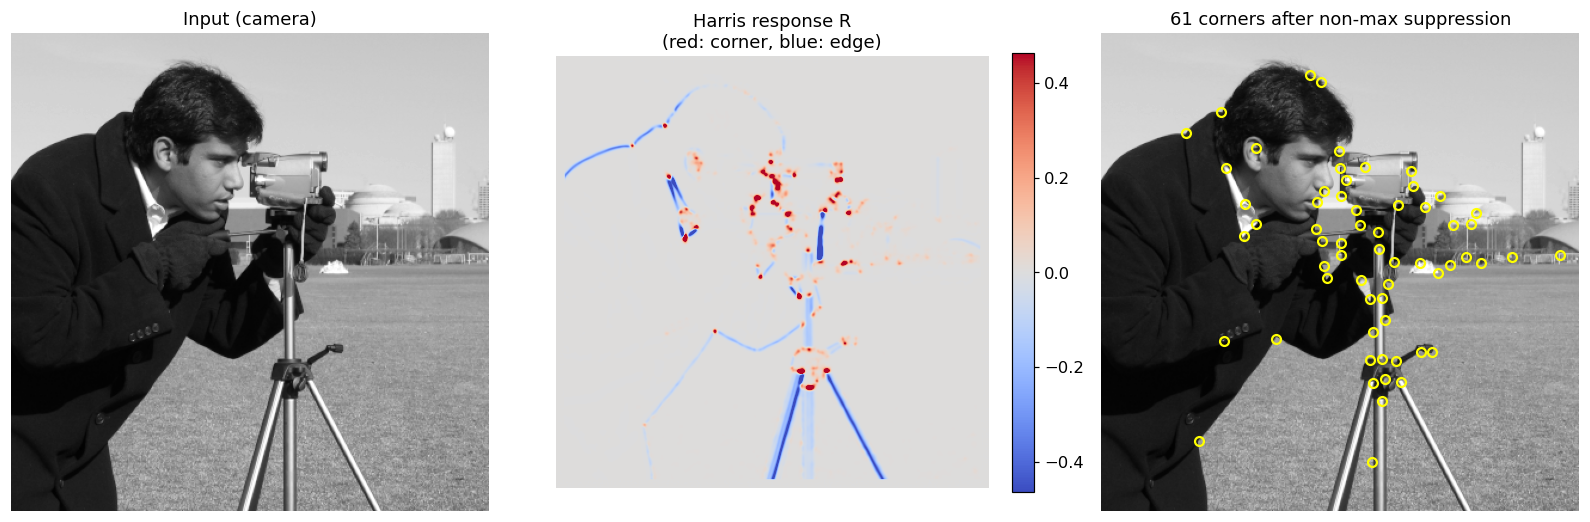
Maximally stable extremal regions (MSER)
Plain version. Imagine slowly flooding a gray-level landscape. Dark letters on bright paper become little lakes. As the water level rises, most lakes grow quickly or merge, but a letter’s lake keeps exactly its shape over a long range of levels, because the ink is much darker than the paper around it. Regions that barely change while the level changes a lot are maximally stable. Matas, Chum, Urban and Pajdla introduced them for wide-baseline stereo [5].
Precise version. Threshold the image at every level . A connected component of (or of , for bright regions) is an extremal region : every pixel inside is darker (or brighter) than every pixel on its outer boundary. As increases, the components grow and merge, forming a tree. For each region, define the stability
where is area and a step in gray levels. A region is maximally stable when has a local minimum. The whole tree can be built in near-linear time using a union-find structure over pixels sorted by intensity.
Why it works: the definition uses only the order of intensities, so MSERs are invariant to any monotonic change of brightness. Connected regions map to connected regions under continuous geometric changes, so MSERs are covariant with affine transformations (commonly an ellipse is fitted to each region and normalized to a circle before describing it). MSERs work best on well-defined uniform blobs, such as text, signs and windows, and poorly on blurred or highly textured scenes.
Code · Python · 7 lines
import cv2
from skimage import data

img = data.page()                                    # uint8 grayscale
mser = cv2.MSER_create(delta=5, min_area=10, max_area=800, max_variation=0.5)
regions, boxes = mser.detectRegions(img)             # pixel lists + bounding boxes
print(len(regions), "regions")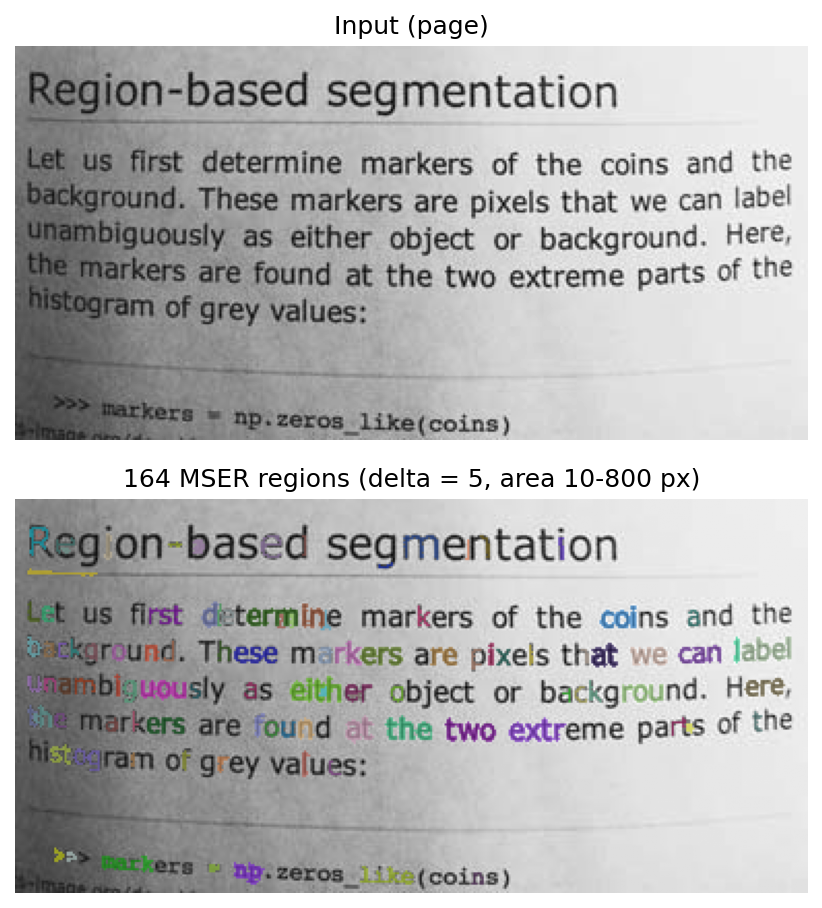
Scale-invariant feature transform (SIFT)
Plain version. SIFT, introduced by Lowe [6], answers three questions about every landmark: where is it, how big is it, and which way is it facing? Then it writes down a summary of the gradients around it, measured in that landmark’s own size and direction, so the summary is less sensitive to changes of scale, in-plane rotation and contrast. Strong viewpoint or illumination changes can still alter it.
Optional: SIFT (in the Paper guides). Connect the descriptor diagram to the original matching experiments and their transformation settings.
Scale space
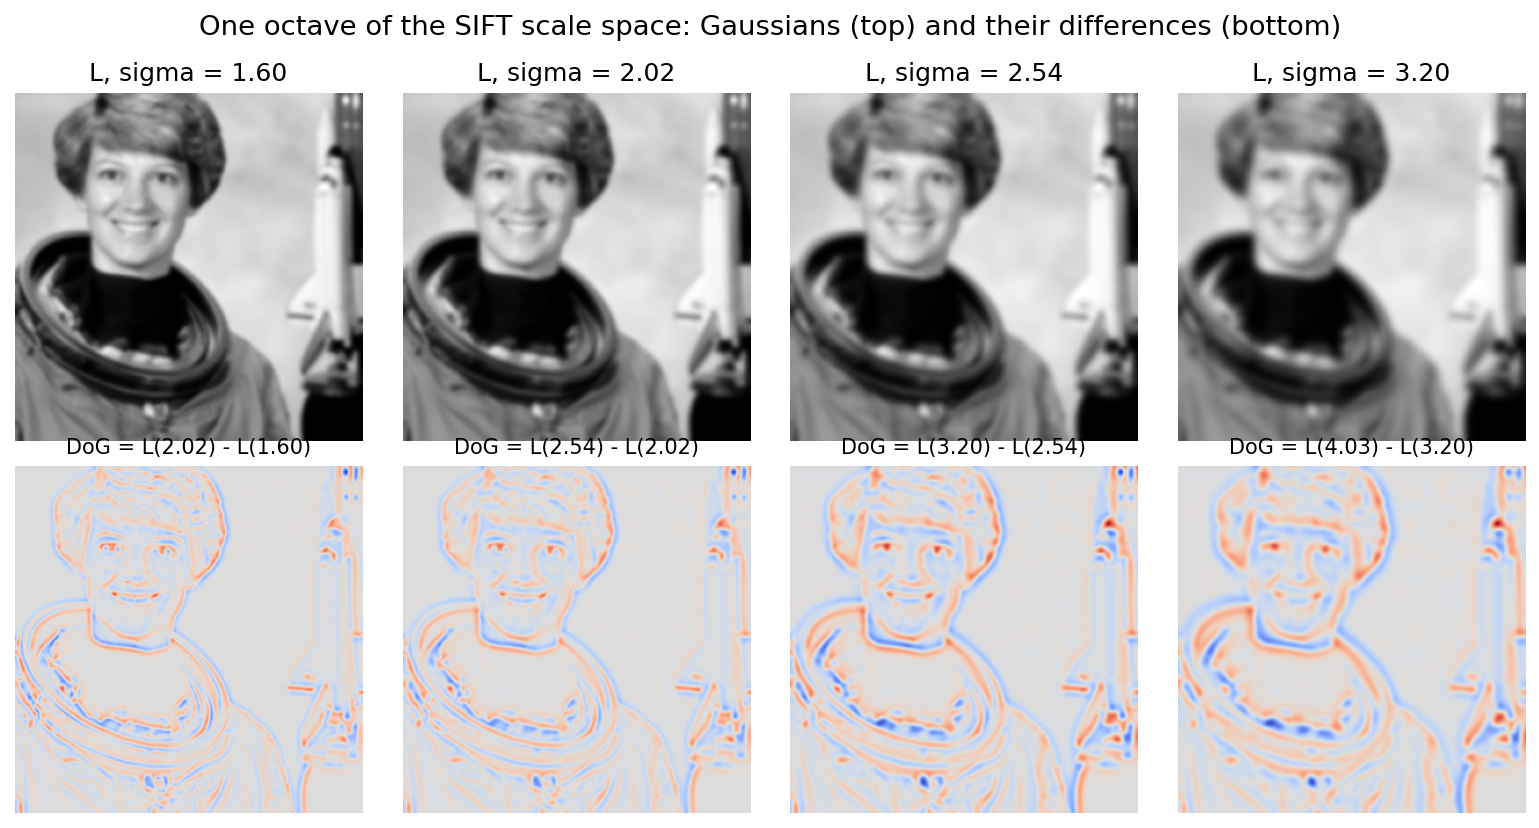
To find features at every size, SIFT builds a scale space: the image blurred by Gaussians of increasing width,
where denotes convolution and the scale. The scales are grouped into octaves; each octave doubles and is divided into intervals, so consecutive scales differ by a factor . Lowe [6] uses and a base scale . After each octave the image is downsampled by 2, which keeps the cost low.
Keypoint detection with difference of Gaussians
In plain words: subtracting two blurred copies of the image highlights blobs of one particular size; keypoints are the places where this response is strongest.
Adjacent blurred images are subtracted:
This difference of Gaussians (DoG) is a close approximation of the scale-normalized Laplacian of Gaussian, , scaled by the constant . It responds strongly to blobs whose size matches (Figure 12.7). Candidate keypoints are the pixels whose value is larger or smaller than all 26 neighbors: 8 in the same DoG image and 9 in each of the scales above and below. A keypoint therefore comes with a position and a characteristic scale.
Optional: Keypoint localization (in the Supplementary notes). How SIFT refines keypoints to sub-pixel accuracy and discards unstable ones.
Orientation assignment
In plain words: give each keypoint a direction, the dominant gradient direction around it, so that later measurements can be made relative to it.
Around each keypoint, compute gradient magnitudes and directions in at the keypoint’s scale. Build a 36-bin histogram of directions (10° per bin), each sample weighted by its gradient magnitude and by a Gaussian window with equal to 1.5 times the keypoint scale. The highest peak gives the keypoint’s orientation; any other peak above 80% of the highest creates an additional keypoint with that orientation [6]. From now on, all measurements are made relative to this orientation, which gives rotation invariance.
The keypoint descriptor
In plain words: summarize the gradients around the keypoint in a small grid of direction histograms, measured in the keypoint’s own size and direction.
Take a window around the keypoint, rotated to its orientation and sized by its scale. Divide it into a grid of cells. In each cell, accumulate an 8-bin histogram of gradient directions, weighted by magnitude and a Gaussian centered on the keypoint, with trilinear interpolation so that small shifts do not cause sudden jumps between bins. This gives numbers [6]. Finally:
- normalize the vector to unit length (cancels contrast changes ; gradients already cancel ),
- clip every element at 0.2 (limits the influence of a few very large gradients caused by nonlinear lighting such as glare),
- renormalize to unit length.
Matching
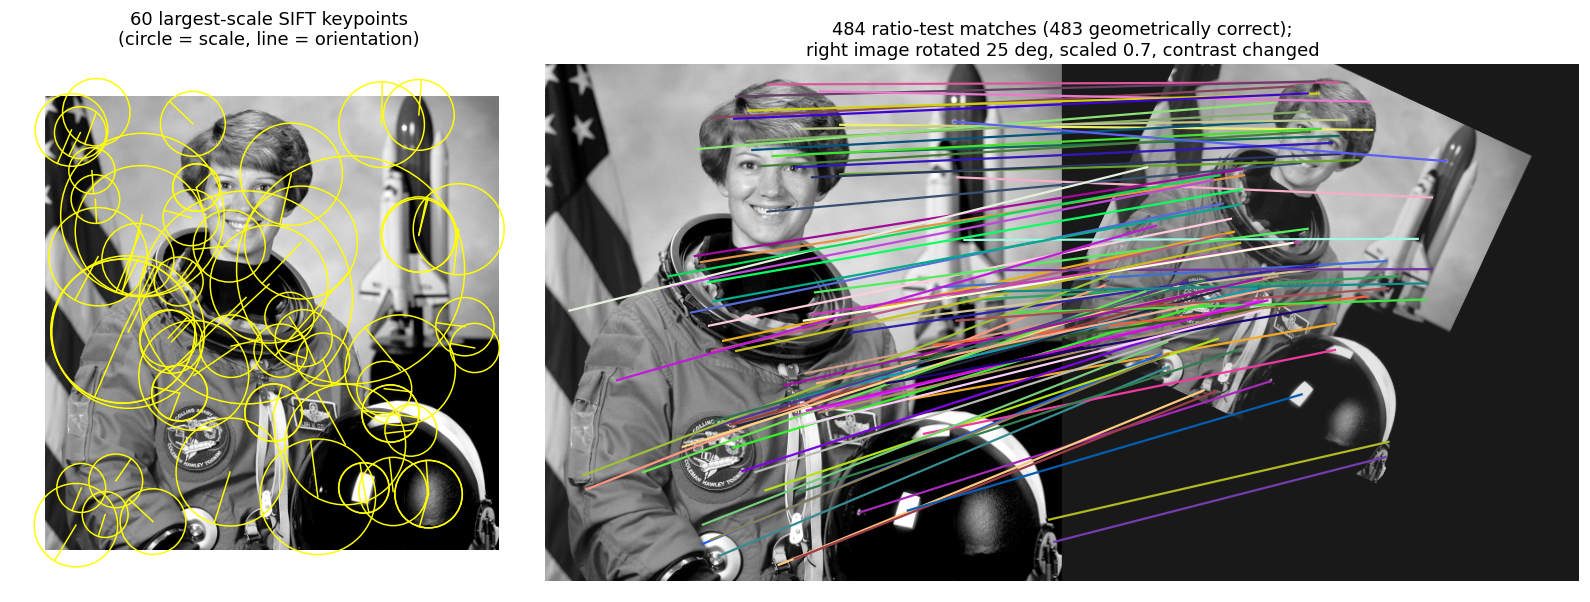
Descriptors from two images are compared by Euclidean distance. The nearest neighbor alone is not reliable: many keypoints have no true match at all. Lowe’s ratio test keeps a match only if
where are the nearest and second-nearest descriptors in the other image and a threshold (Lowe suggests 0.8) [6]. A distinctive match is much closer than the runner-up. Large databases use approximate nearest-neighbor search, and the surviving matches are usually verified geometrically, for example by fitting a similarity, affine, or projective transformation with RANSAC (random sample consensus) [21] and keeping the inliers. RANSAC is introduced in the Supplementary notes.
Code · Python · 19 lines
import numpy as np
from skimage import data, feature, transform
from skimage.color import rgb2gray
from skimage.measure import ransac

img1 = rgb2gray(data.astronaut())
tf = transform.AffineTransform(scale=0.7, rotation=np.deg2rad(25), translation=(140, -60))
img2 = 0.8 * transform.warp(img1, tf.inverse) + 0.1        # second "view"

sift = feature.SIFT()
sift.detect_and_extract(img1); k1, d1 = sift.keypoints, sift.descriptors
sift.detect_and_extract(img2); k2, d2 = sift.keypoints, sift.descriptors

matches = feature.match_descriptors(d1, d2, max_ratio=0.6, cross_check=True)  # ratio test
src, dst = k1[matches[:, 0]][:, ::-1], k2[matches[:, 1]][:, ::-1]           # (row, col) -> (x, y)
model, inliers = ransac((src, dst), transform.SimilarityTransform,
                        min_samples=3, residual_threshold=2, max_trials=500)
print(len(matches), "matches,", inliers.sum(), "inliers")
print("recovered scale %.3f, rotation %.1f deg" % (model.scale, np.degrees(model.rotation)))
On this synthetic pair the script finds 484 matches, 483 of them consistent with the true transformation, and recovers scale 0.700 and rotation 25.0°. Real photo pairs, with viewpoint changes, occlusion and repeated patterns, give far lower inlier ratios, which is why geometric verification is not optional.
Modern view
What the surveys say
Shape descriptors. Zhang and Lu [9] sort shape descriptors into contour-based versus region-based and global versus structural; every boundary and region descriptor of this chapter fits that grid, and no single descriptor is best for every application.
Local feature detectors. Tuytelaars and Mikolajczyk [10] organize detectors around the properties a good local feature should have, above all repeatability, which can be reached by invariance or by robustness; some properties compete, so the right compromise depends on the application. The speed-oriented descendants of SIFT illustrate the trade-off: SURF [7] uses box filters on integral images, and ORB [8] pairs the FAST corner test with a binary descriptor.
Texture. Liu et al. [11] review about two decades of texture representation, from bag-of-words pipelines built on hand-designed local descriptors to CNN-based representations; co-occurrence statistics [3] sit at the root of this history.
Image matching, handcrafted to deep. Ma et al. [12] show that learning has entered every stage of the matching pipeline. Jin et al. [13] score methods by the accuracy of the final camera poses and find that properly tuned classical pipelines such as SIFT can still beat methods perceived as the state of the art.
Optional: Guide to the Modern view surveys (in the Paper guides). What each survey covers, how it organizes the field, and its main takeaways.
How deep learning changed feature extraction
Learned keypoints and descriptors. SuperPoint [14] trains one network to output both a keypoint heatmap and dense descriptors, self-supervised through homographic adaptation; DISK [16] trains detection and description end to end with reinforcement learning. They replace the formulas of Harris and SIFT with learned functions but keep the same idea: sparse, repeatable points with descriptors.
Learned matching. SuperGlue [15] and its faster successor LightGlue [18] let the keypoints of both images attend to each other instead of applying the ratio test, and solve an assignment that can also say “no match”. LoFTR [17] removes the detector and matches dense feature maps with a Transformer, which helps in low-texture areas.
General-purpose deep features. Self-supervised foundation models such as DINOv2 [19] produce patch features that work across many tasks without fine-tuning, and matchers such as RoMa [20] build on them: the handcrafted descriptor at the center of SIFT has been replaced by a network trained on a very large image collection.
Optional: Learned features in more detail (in the Supplementary notes). How each of these methods is trained, how it matches, and what problem it solves.
What did not change. The problem decomposition of this chapter survives. Modern pipelines still detect, describe, match and verify geometrically, typically still with a RANSAC-style robust estimator [21]. Scale and rotation still have to be handled, either built in (SIFT’s scale space, ORB’s orientation) or learned from data augmentation. Invariance is still a design choice: a descriptor that is too invariant loses discriminative power, whether it was handcrafted or learned. And in measurement-driven fields (materials, microscopy, quality inspection), region descriptors such as area, circularity, Euler number and GLCM statistics remain popular because each number has a physical meaning a human can check.
Key takeaways
- A detector finds features (points, regions, boundaries); a descriptor turns each into a vector. Detectors should be covariant with geometric changes; descriptors should be invariant to the changes that do not matter for the task.
- Boundaries are first ordered (boundary following) and simplified (chain codes, minimum-perimeter polygons, merging and splitting, signatures, skeletons) before being measured.
- Fourier descriptors compress a closed contour into a few coefficients; dropping , dividing by and keeping magnitudes gives translation, scale, rotation and start-point invariance.
- Region descriptors range from size and shape (area, circularity, eccentricity) to topology (Euler number ), texture (histogram moments, GLCM features, spectral signatures) and Hu’s moment invariants.
- PCA (the Hotelling transform) decorrelates measurements, aligns objects to their principal axes, and gives compact eigen-image descriptors; the error from dropping components equals the sum of the dropped eigenvalues.
- Harris finds corners from the structure tensor; MSER finds regions stable over many thresholds; SIFT adds scale space, orientation and a normalized 128-D gradient histogram, then matches with the ratio test.
- Learned detectors, matchers and foundation-model features are now the focus of most matching research, but carefully tuned classical pipelines remain strong baselines, and the detect–describe–match–verify structure has not changed.
Exercises
- Chain codes by hand. Write the 8-direction chain code of an axis-aligned rectangle of boundary links (3 links wide, 2 tall), starting at its lower-left corner and walking counterclockwise. Compute its first difference and the shape number (minimum circular rotation). Then rotate the rectangle by 90° and show the shape number does not change.
Hint
Walking counterclockwise from the lower-left corner (with 0 = east, 2 = north): . Each element of the first difference counts counterclockwise turns from the previous direction: (the leading 2 comes from the wrap-around, ). Its smallest circular rotation is . After a 90° turn every code element increases by 2 (mod 8), which leaves the differences unchanged.
- Fourier descriptor invariance, tested. Take the
fourier_descriptorfunction from this chapter. (a) Show numerically that it fails to distinguish a shape from its mirror image. (b) Explain why from the table of transformation effects, and propose a change that would tell mirror images apart.
Hint
Flip the mask with mask[:, ::-1] and trace both contours with find_contours; the descriptors agree to within about . A tracer walks every boundary in the same rotational sense, so the mirrored boundary is (conjugate and reversed), up to a shift. Its DFT is : the same magnitudes, opposite phases. Magnitudes cannot see the reflection. Keep some phase instead: the complex number (indices modulo ) is unchanged by translation, rotation, scale and start point, but it is conjugated by a reflection, so the sign of its imaginary part tells a shape from its mirror image.
- Circularity on a grid. Compute for digital disks of radius 5, 10, 20 and 50 pixels using
skimage.draw.diskandregionprops. Why is the result not exactly 1, and how does it change with radius? Tryperimeter_croftonas well.
Hint
The digital perimeter is a staircase, and different estimators correct for this differently. Errors are relatively larger for small disks. Report both perimeter estimates; one of them should be noticeably closer to the true .
- Texture direction. Create a synthetic texture of horizontal stripes with period 8 pixels plus a little noise. Compute GLCM contrast for offsets of 1 pixel at angles 0°, 45°, 90° and 135°, and the angular spectral signature . Which angle stands out in each, and why do the two methods agree?
Hint
Moving along a stripe (0°) keeps intensity almost constant, so contrast is low; moving across stripes (90°) changes it. In the spectrum, horizontal stripes put energy on the vertical frequency axis. Watch the convention: scikit-image’s angle 0 means a horizontal pixel offset.
- PCA by eigenvalues. For a filled ellipse with semi-axes and , predict the ratio of the coordinate-covariance eigenvalues, then verify it in code. Use your answer to relate to the eccentricity reported by
regionprops.
Hint
For a uniform filled ellipse, the variance along a semi-axis of length is . So , and .
- Ratio test trade-off. Using the SIFT matching script, vary
max_ratiofrom 0.5 to 0.95 and plot (a) the number of matches and (b) the fraction of RANSAC inliers. Then add a 0.6× rescale plus 30° rotation plus Gaussian noise () and repeat. Where would you set the threshold, and why does the answer depend on the noise?
Hint
A loose ratio admits more matches but more of them are wrong; a strict ratio keeps few, mostly correct ones. RANSAC can tolerate many outliers but needs a minimum number of correct matches, so the best threshold sits between the two extremes and moves with image quality.
References
- R. C. Gonzalez and R. E. Woods, Digital Image Processing, 4th ed., Pearson, 2018, Ch. 12. publisher page
- M.-K. Hu, “Visual pattern recognition by moment invariants,” IRE Transactions on Information Theory, vol. 8, no. 2, pp. 179–187, 1962. doi
- R. M. Haralick, K. Shanmugam, and I. Dinstein, “Textural features for image classification,” IEEE Transactions on Systems, Man, and Cybernetics, vol. SMC-3, no. 6, pp. 610–621, 1973. doi
- C. Harris and M. Stephens, “A combined corner and edge detector,” in Proc. Alvey Vision Conference, pp. 23.1–23.6, 1988. doi
- J. Matas, O. Chum, M. Urban, and T. Pajdla, “Robust wide-baseline stereo from maximally stable extremal regions,” Image and Vision Computing, vol. 22, no. 10, pp. 761–767, 2004. doi
- D. G. Lowe, “Distinctive image features from scale-invariant keypoints,” International Journal of Computer Vision, vol. 60, no. 2, pp. 91–110, 2004. doi
- H. Bay, A. Ess, T. Tuytelaars, and L. Van Gool, “Speeded-up robust features (SURF),” Computer Vision and Image Understanding, vol. 110, no. 3, pp. 346–359, 2008. doi
- E. Rublee, V. Rabaud, K. Konolige, and G. Bradski, “ORB: An efficient alternative to SIFT or SURF,” in Proc. IEEE International Conference on Computer Vision (ICCV), pp. 2564–2571, 2011. doi
- D. Zhang and G. Lu, “Review of shape representation and description techniques,” Pattern Recognition, vol. 37, no. 1, pp. 1–19, 2004. doi
- T. Tuytelaars and K. Mikolajczyk, “Local invariant feature detectors: A survey,” Foundations and Trends in Computer Graphics and Vision, vol. 3, no. 3, pp. 177–280, 2008. doi
- L. Liu, J. Chen, P. Fieguth, G. Zhao, R. Chellappa, and M. Pietikäinen, “From BoW to CNN: Two decades of texture representation for texture classification,” International Journal of Computer Vision, vol. 127, pp. 74–109, 2019. arXiv
- J. Ma, X. Jiang, A. Fan, J. Jiang, and J. Yan, “Image matching from handcrafted to deep features: A survey,” International Journal of Computer Vision, vol. 129, pp. 23–79, 2021. doi
- Y. Jin, D. Mishkin, A. Mishchuk, J. Matas, P. Fua, K. M. Yi, and E. Trulls, “Image matching across wide baselines: From paper to practice,” International Journal of Computer Vision, 2021. doi · arXiv
- D. DeTone, T. Malisiewicz, and A. Rabinovich, “SuperPoint: Self-supervised interest point detection and description,” arXiv:1712.07629, 2017. arXiv
- P.-E. Sarlin, D. DeTone, T. Malisiewicz, and A. Rabinovich, “SuperGlue: Learning feature matching with graph neural networks,” arXiv:1911.11763, 2019. arXiv
- M. J. Tyszkiewicz, P. Fua, and E. Trulls, “DISK: Learning local features with policy gradient,” arXiv:2006.13566, 2020. arXiv
- J. Sun, Z. Shen, Y. Wang, H. Bao, and X. Zhou, “LoFTR: Detector-free local feature matching with Transformers,” arXiv:2104.00680, 2021. arXiv
- P. Lindenberger, P.-E. Sarlin, and M. Pollefeys, “LightGlue: Local feature matching at light speed,” arXiv:2306.13643, 2023. arXiv
- M. Oquab, T. Darcet, T. Moutakanni, et al., “DINOv2: Learning robust visual features without supervision,” arXiv:2304.07193, 2023. arXiv
- J. Edstedt, Q. Sun, G. Bökman, M. Wadenbäck, and M. Felsberg, “RoMa: Robust dense feature matching,” in Proc. IEEE/CVF Conference on Computer Vision and Pattern Recognition (CVPR), 2024. arXiv
- M. A. Fischler and R. C. Bolles, “Random sample consensus: A paradigm for model fitting with applications to image analysis and automated cartography,” Communications of the ACM, vol. 24, no. 6, pp. 381–395, 1981. doi
- scikit-image contributors, “skimage.measure.ransac,” scikit-image 0.26 documentation (API reference). docs
Check your understanding
This tutorial has 6 exercises. Can you solve them without opening the hints?
Go to the exercises ↑Next IP 13 · Image Pattern Classification · 28 min